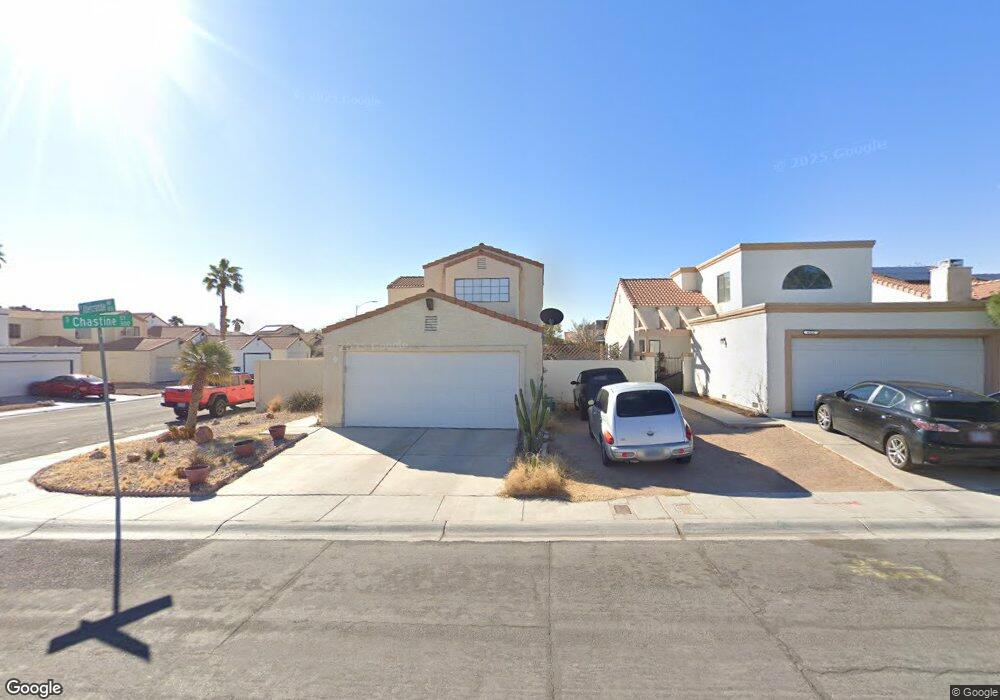
8217 Abercrombe Way Las Vegas, NV 89145
Angel Park NeighborhoodEstimated Value: $387,726 - $415,000
3
Beds
2
Baths
1,514
Sq Ft
$264/Sq Ft
Est. Value
About This Home
This home is located at 8217 Abercrombe Way, Las Vegas, NV 89145 and is currently estimated at $399,932, approximately $264 per square foot. 8217 Abercrombe Way is a home located in Clark County with nearby schools including Walter Jacobson Elementary School, Walter Johnson Junior High School Academy of International Studies, and Bonanza High School.
Ownership History
Date
Name
Owned For
Owner Type
Purchase Details
Closed on
Jun 6, 2016
Sold by
Chung Kim Sheung
Bought by
The Kim Sheung Chung Living Trust
Current Estimated Value
Purchase Details
Closed on
Jul 25, 2013
Sold by
Lee Jimmy M and Lee May
Bought by
Sheung Chung and Sheung Kim
Purchase Details
Closed on
Apr 2, 2001
Sold by
Lee May
Bought by
Lee Jimmy
Home Financials for this Owner
Home Financials are based on the most recent Mortgage that was taken out on this home.
Original Mortgage
$104,000
Interest Rate
7.19%
Purchase Details
Closed on
Feb 3, 1994
Sold by
Billingsley Emily Ann
Bought by
Lee Jimmy and Lee May
Home Financials for this Owner
Home Financials are based on the most recent Mortgage that was taken out on this home.
Original Mortgage
$12,460
Interest Rate
6.98%
Mortgage Type
Seller Take Back
Create a Home Valuation Report for This Property
The Home Valuation Report is an in-depth analysis detailing your home's value as well as a comparison with similar homes in the area
Home Values in the Area
Average Home Value in this Area
Purchase History
| Date | Buyer | Sale Price | Title Company |
|---|---|---|---|
| The Kim Sheung Chung Living Trust | -- | None Available | |
| Sheung Chung | $100,000 | None Available | |
| Lee Jimmy | -- | First American Title Co | |
| Lee Jimmy | $27,500 | Fidelity National Title |
Source: Public Records
Mortgage History
| Date | Status | Borrower | Loan Amount |
|---|---|---|---|
| Previous Owner | Lee Jimmy | $104,000 | |
| Previous Owner | Lee Jimmy | $12,460 |
Source: Public Records
Tax History Compared to Growth
Tax History
| Year | Tax Paid | Tax Assessment Tax Assessment Total Assessment is a certain percentage of the fair market value that is determined by local assessors to be the total taxable value of land and additions on the property. | Land | Improvement |
|---|---|---|---|---|
| 2025 | $1,617 | $69,814 | $30,100 | $39,714 |
| 2024 | $1,498 | $69,814 | $30,100 | $39,714 |
| 2023 | $1,498 | $66,744 | $28,350 | $38,394 |
| 2022 | $1,387 | $58,108 | $22,750 | $35,358 |
| 2021 | $1,284 | $56,783 | $22,750 | $34,033 |
| 2020 | $1,190 | $53,705 | $19,600 | $34,105 |
| 2019 | $1,115 | $49,972 | $16,100 | $33,872 |
| 2018 | $1,064 | $48,189 | $15,400 | $32,789 |
| 2017 | $1,557 | $47,503 | $14,000 | $33,503 |
| 2016 | $997 | $44,551 | $10,500 | $34,051 |
| 2015 | $994 | $39,215 | $8,750 | $30,465 |
| 2014 | $963 | $33,196 | $6,475 | $26,721 |
Source: Public Records
Map
Nearby Homes
- 8229 Willeta Ave
- 8229 Ducharme Ave
- 8233 Ducharme Ave
- 332 Dockside Ct
- 8204 Charles Turk Dr
- 601 Ordrich Place
- 105 S Cimarron Rd
- 8450 Alta Dr Unit 204
- 8417 Running Deer Ave Unit 101
- 7873 Mount Whitney Cir
- 525 Indian Princess Dr Unit 101
- 104 Hutton Ln
- 7912 Foxwood Place Unit 104
- 425 Cherry Meadows Ct
- 613 Yacht Harbor Dr Unit 1111
- 709 Jonathan Glen Way
- 7830 Foxwood Place Unit 6011
- 100 Breezy Tree Ct Unit 104
- 8305 Cherry Glaze Ave Unit 203
- 605 Devonhall St Unit 201
- 8221 Abercrombe Way
- 8225 Abercrombe Way
- 8220 Willeta Ave
- 8229 Abercrombe Way
- 329 Chastine St
- 325 Chastine St
- 333 Chastine St
- 8224 Willeta Ave
- 321 Chastine St
- 337 Chastine St
- 8233 Abercrombe Way
- 8216 Abercrombe Way
- 8220 Abercrombe Way
- 317 Chastine St
- 8228 Willeta Ave
- 341 Chastine St
- 8224 Abercrombe Way
- 313 Chastine St
- 8228 Abercrombe Way
- 8232 Willeta Ave