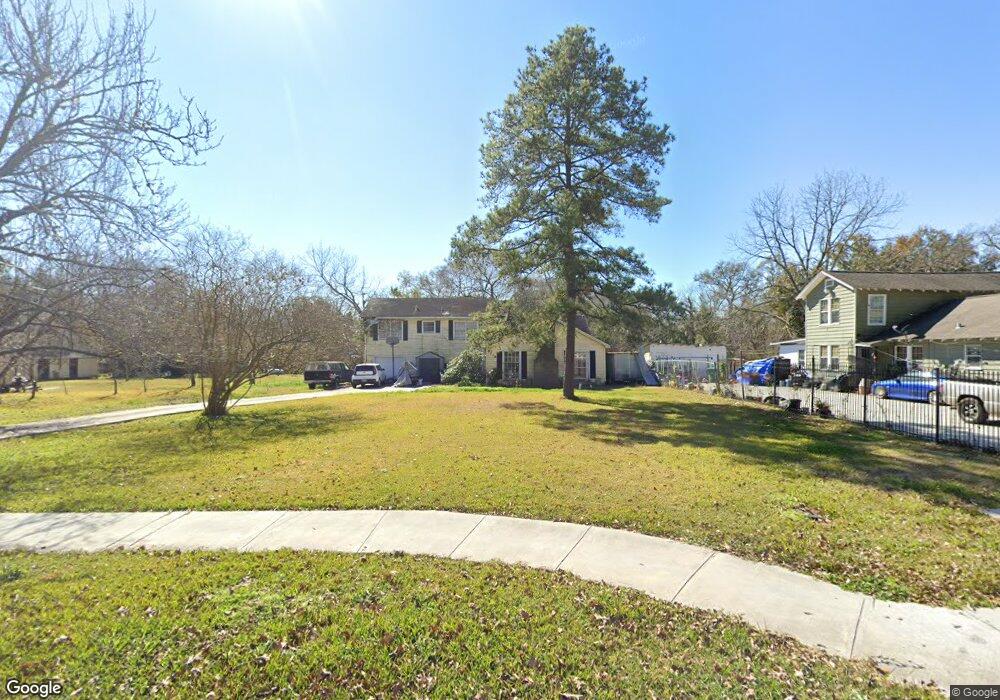
8218 Concord St Houston, TX 77017
Park Place NeighborhoodEstimated Value: $303,000 - $382,000
3
Beds
2
Baths
3,052
Sq Ft
$114/Sq Ft
Est. Value
About This Home
This home is located at 8218 Concord St, Houston, TX 77017 and is currently estimated at $348,381, approximately $114 per square foot. 8218 Concord St is a home located in Harris County with nearby schools including Sanchez Elementary School, Chavez High School, and YES Prep - East End.
Ownership History
Date
Name
Owned For
Owner Type
Purchase Details
Closed on
Dec 27, 2000
Sold by
Scb Properties Inc and Lee Jesse
Bought by
Buren Joseph and Buren Elizabeth
Current Estimated Value
Home Financials for this Owner
Home Financials are based on the most recent Mortgage that was taken out on this home.
Original Mortgage
$94,500
Interest Rate
7.78%
Purchase Details
Closed on
Apr 29, 2000
Sold by
Jester Pr Holdings
Bought by
Scb Properties Inc
Home Financials for this Owner
Home Financials are based on the most recent Mortgage that was taken out on this home.
Original Mortgage
$39,211
Interest Rate
8.24%
Purchase Details
Closed on
Apr 20, 2000
Sold by
Federal National Mortgage Association
Bought by
Jester Pr Holdings
Home Financials for this Owner
Home Financials are based on the most recent Mortgage that was taken out on this home.
Original Mortgage
$39,211
Interest Rate
8.24%
Create a Home Valuation Report for This Property
The Home Valuation Report is an in-depth analysis detailing your home's value as well as a comparison with similar homes in the area
Home Values in the Area
Average Home Value in this Area
Purchase History
| Date | Buyer | Sale Price | Title Company |
|---|---|---|---|
| Buren Joseph | -- | -- | |
| Scb Properties Inc | -- | -- | |
| Jester Pr Holdings | -- | Texas American Title Company |
Source: Public Records
Mortgage History
| Date | Status | Borrower | Loan Amount |
|---|---|---|---|
| Closed | Buren Joseph | $94,500 | |
| Previous Owner | Jester Pr Holdings | $39,211 | |
| Closed | Jester Pr Holdings | $30,303 |
Source: Public Records
Tax History Compared to Growth
Tax History
| Year | Tax Paid | Tax Assessment Tax Assessment Total Assessment is a certain percentage of the fair market value that is determined by local assessors to be the total taxable value of land and additions on the property. | Land | Improvement |
|---|---|---|---|---|
| 2025 | $159 | $353,539 | $156,450 | $197,089 |
| 2024 | $159 | $349,675 | $156,450 | $193,225 |
| 2023 | $159 | $389,033 | $156,450 | $232,583 |
| 2022 | $5,280 | $308,868 | $156,450 | $152,418 |
| 2021 | $5,081 | $218,000 | $111,750 | $106,250 |
| 2020 | $4,831 | $232,647 | $111,750 | $120,897 |
| 2019 | $4,589 | $181,345 | $94,988 | $86,357 |
| 2018 | $3,139 | $169,113 | $63,698 | $105,415 |
| 2017 | $4,276 | $169,113 | $63,698 | $105,415 |
| 2016 | $4,276 | $169,113 | $63,698 | $105,415 |
| 2015 | $2,832 | $169,113 | $63,698 | $105,415 |
| 2014 | $2,832 | $145,663 | $63,698 | $81,965 |
Source: Public Records
Map
Nearby Homes
- 8145 Easton St
- 8158 Easton St
- 8515 Carlisle St
- 8324 Jennings St
- 8023 Findlay St
- 8502 Detroit St Unit D
- 8502 Detroit St Unit C
- 8282 Park Place Blvd Unit D1
- 8282 Park Place Blvd Unit G2
- 7937 Grafton St
- 8250 Park Place Blvd Unit 303
- 8432 Park Place Blvd
- 7313 Gulf Fwy Unit 814
- 7313 Gulf Fwy Unit 911
- 7313 Gulf Fwy Unit 1011
- 7303 Gulf Fwy Unit 903
- 3727 Broadway St
- 7814 Glover St
- 7931 Scanlock St
- 7 W Court Dr
- 8240 Concord St
- 8216 Concord St
- 8214 Concord St
- 8229 Concord St
- 8206 Concord St
- 8241 Detroit St
- 8301 Concord St
- 8316 Concord St
- 8243 Detroit St
- 8215 Concord St
- 2922 Dalton St
- 2919 Dalton St
- 2917 Dalton St
- 8217 Concord St
- 8225 Detroit St
- 8311 Concord St
- 2918 Dalton St
- 8223 Detroit St
- 8245 Detroit St
- 2923 Chicago St