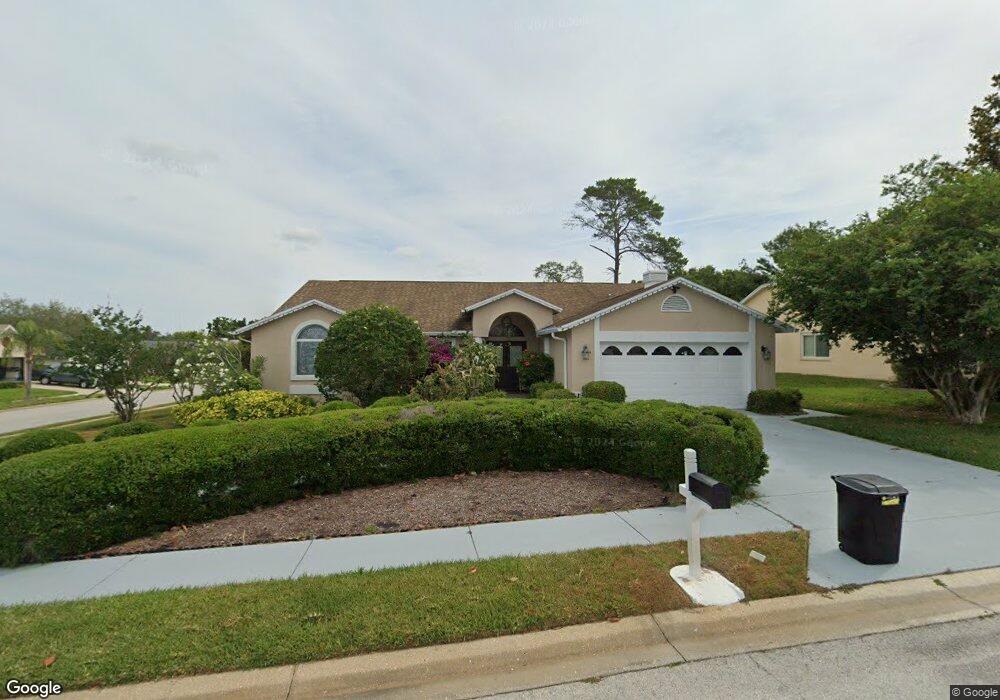
8218 Danbury Ln Hudson, FL 34667
Beacon Woods NeighborhoodEstimated Value: $324,000 - $415,000
3
Beds
2
Baths
2,471
Sq Ft
$154/Sq Ft
Est. Value
About This Home
This home is located at 8218 Danbury Ln, Hudson, FL 34667 and is currently estimated at $380,393, approximately $153 per square foot. 8218 Danbury Ln is a home located in Pasco County with nearby schools including West Pasco Education Academy, Hudson Middle School, and Hudson High School.
Ownership History
Date
Name
Owned For
Owner Type
Purchase Details
Closed on
Apr 5, 2019
Sold by
Venture Carlos and Venture Monserrate
Bought by
Zene Santiago Latarsha
Current Estimated Value
Home Financials for this Owner
Home Financials are based on the most recent Mortgage that was taken out on this home.
Original Mortgage
$140,415
Outstanding Balance
$124,236
Interest Rate
4.62%
Mortgage Type
FHA
Estimated Equity
$256,157
Purchase Details
Closed on
Jun 9, 2005
Sold by
Karras George and Karras Ismini
Bought by
Ventura Carlos and Ventura Monserrate
Home Financials for this Owner
Home Financials are based on the most recent Mortgage that was taken out on this home.
Original Mortgage
$163,800
Interest Rate
5.69%
Mortgage Type
Fannie Mae Freddie Mac
Purchase Details
Closed on
Jun 1, 2004
Sold by
Cerbo Patrick and Cerbo Jennie
Bought by
Karras George and Karras Ismini
Create a Home Valuation Report for This Property
The Home Valuation Report is an in-depth analysis detailing your home's value as well as a comparison with similar homes in the area
Home Values in the Area
Average Home Value in this Area
Purchase History
| Date | Buyer | Sale Price | Title Company |
|---|---|---|---|
| Zene Santiago Latarsha | $168,000 | Attorney | |
| Ventura Carlos | $234,000 | -- | |
| Karras George | $190,000 | -- |
Source: Public Records
Mortgage History
| Date | Status | Borrower | Loan Amount |
|---|---|---|---|
| Open | Zene Santiago Latarsha | $140,415 | |
| Previous Owner | Ventura Carlos | $163,800 |
Source: Public Records
Tax History Compared to Growth
Tax History
| Year | Tax Paid | Tax Assessment Tax Assessment Total Assessment is a certain percentage of the fair market value that is determined by local assessors to be the total taxable value of land and additions on the property. | Land | Improvement |
|---|---|---|---|---|
| 2025 | $3,171 | $219,520 | -- | -- |
| 2024 | $3,171 | $213,340 | -- | -- |
| 2023 | $3,051 | $207,130 | $0 | $0 |
| 2022 | $2,740 | $201,100 | $0 | $0 |
| 2021 | $2,685 | $195,250 | $28,086 | $167,164 |
| 2020 | $2,640 | $192,554 | $24,903 | $167,651 |
| 2019 | $3,316 | $205,207 | $24,903 | $180,304 |
| 2018 | $2,925 | $168,096 | $24,903 | $143,193 |
| 2017 | $2,727 | $153,093 | $24,903 | $128,190 |
| 2016 | $2,488 | $138,887 | $24,903 | $113,984 |
| 2015 | $2,435 | $132,845 | $24,903 | $107,942 |
| 2014 | $2,271 | $126,666 | $23,203 | $103,463 |
Source: Public Records
Map
Nearby Homes
- 8311 Danbury Ln
- 8345 Pavilion Dr
- 8401 Pavilion Dr
- 8417 Danbury Ln
- 8404 Millwood Dr
- 13617 Woodside Dr
- 7009 Hudson Ave
- 8521 Caitlin Ct
- 8402 Roxboro Dr
- 8540 Caitlin Ct
- 14024 Emerald Fields Dr
- 13998 Emerald Fields Dr
- 8101 Roxboro Dr
- Hanover Plan at Emerald Fields - Townhomes at Emerald Fields
- Shoreline Plan at Emerald Fields
- Gulfside Plan at Emerald Fields
- Redland Plan at Emerald Fields - Townhomes at Emerald Fields
- Tidewater Plan at Emerald Fields
- Hartsfield Plan at Emerald Fields
- 7963 Chandler Lake Ct
- 8302 Danbury Ln
- 8237 Danbury Ln
- 8243 Danbury Ln
- 8200 Danbury Ln
- 8310 Danbury Ln
- 8219 Danbury Ln
- 8329 Pavilion Dr
- 8211 Danbury Ln
- 8249 Danbury Ln
- 8225 Danbury Ln
- 8201 Danbury Ln
- 8318 Danbury Ln
- 8337 Pavilion Dr
- 8303 Danbury Ln
- 8328 Pavilion Dr
- 8320 Pavilion Dr
- 8326 Danbury Ln
- 8312 Pavilion Dr
- 8319 Danbury Ln
- 8334 Danbury Ln