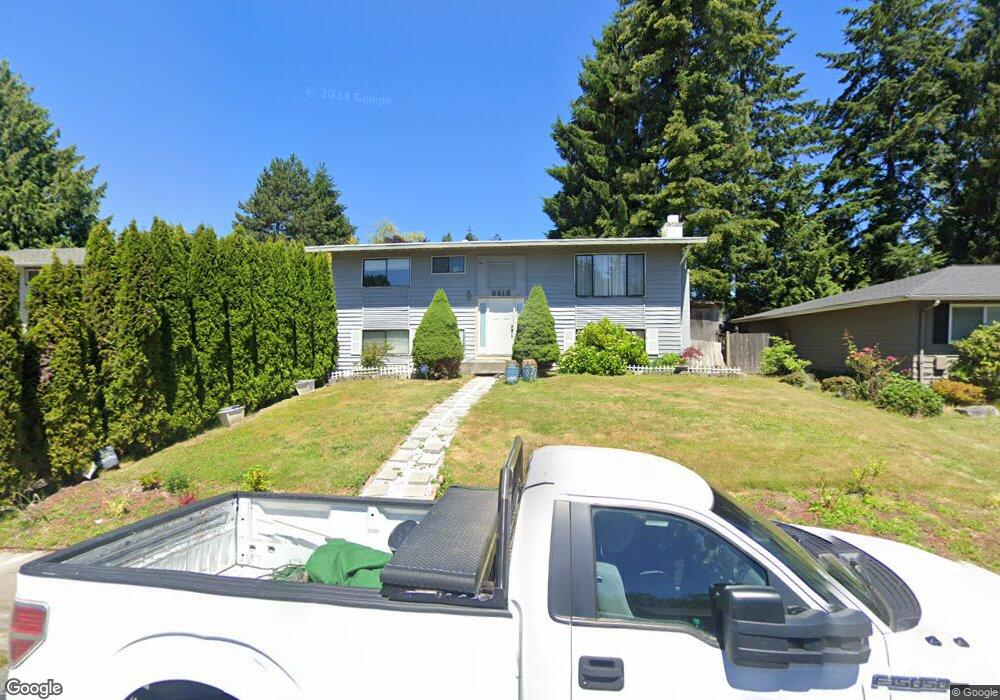
8218 NE 142nd St Bothell, WA 98011
Finn Hill NeighborhoodEstimated Value: $877,988 - $1,148,000
5
Beds
2
Baths
2,000
Sq Ft
$504/Sq Ft
Est. Value
About This Home
This home is located at 8218 NE 142nd St, Bothell, WA 98011 and is currently estimated at $1,008,497, approximately $504 per square foot. 8218 NE 142nd St is a home located in King County with nearby schools including Henry David Thoreau Elementary School, Finn Hill Middle School, and Juanita High School.
Ownership History
Date
Name
Owned For
Owner Type
Purchase Details
Closed on
Jun 10, 2015
Sold by
Roberts Jemima A
Bought by
Roberts Richard B
Current Estimated Value
Purchase Details
Closed on
Jul 20, 2009
Sold by
Roberts Richard B and Roberts Jemima A
Bought by
Bac Home Loans Servicing Lp
Purchase Details
Closed on
May 5, 2004
Sold by
Roberts Lance M and Roberts Sally
Bought by
Roberts Richard B and Roberts Jemima
Home Financials for this Owner
Home Financials are based on the most recent Mortgage that was taken out on this home.
Original Mortgage
$249,969
Interest Rate
5.5%
Mortgage Type
FHA
Purchase Details
Closed on
Apr 18, 1997
Sold by
Roberts Dean M
Bought by
Roberts Lance M
Purchase Details
Closed on
Mar 18, 1997
Sold by
Roberts Dean M and Roberts Jolene R
Bought by
Roberts Dean M
Purchase Details
Closed on
Feb 21, 1997
Sold by
Roberts Dean M
Bought by
Roberts Dean M and Roberts Jolene R
Create a Home Valuation Report for This Property
The Home Valuation Report is an in-depth analysis detailing your home's value as well as a comparison with similar homes in the area
Home Values in the Area
Average Home Value in this Area
Purchase History
| Date | Buyer | Sale Price | Title Company |
|---|---|---|---|
| Roberts Richard B | -- | None Available | |
| Bac Home Loans Servicing Lp | $254,775 | None Available | |
| Roberts Richard B | $253,500 | Lawyers Title | |
| Roberts Lance M | -- | -- | |
| Roberts Dean M | -- | -- | |
| Roberts Dean M | -- | -- |
Source: Public Records
Mortgage History
| Date | Status | Borrower | Loan Amount |
|---|---|---|---|
| Previous Owner | Roberts Richard B | $249,969 |
Source: Public Records
Tax History
| Year | Tax Paid | Tax Assessment Tax Assessment Total Assessment is a certain percentage of the fair market value that is determined by local assessors to be the total taxable value of land and additions on the property. | Land | Improvement |
|---|---|---|---|---|
| 2024 | $6,081 | $728,000 | $452,000 | $276,000 |
| 2023 | $5,512 | $624,000 | $369,000 | $255,000 |
| 2022 | $5,219 | $782,000 | $440,000 | $342,000 |
| 2021 | $4,834 | $570,000 | $320,000 | $250,000 |
| 2020 | $4,719 | $481,000 | $265,000 | $216,000 |
| 2018 | $3,783 | $398,000 | $250,000 | $148,000 |
| 2017 | $3,446 | $355,000 | $223,000 | $132,000 |
| 2016 | $3,314 | $336,000 | $211,000 | $125,000 |
| 2015 | -- | $318,000 | $200,000 | $118,000 |
| 2014 | -- | $294,000 | $182,000 | $112,000 |
| 2013 | -- | $242,000 | $150,000 | $92,000 |
Source: Public Records
Map
Nearby Homes
- 14401 82nd Ave NE
- 14505 84th Ave NE
- 8703 NE 144th Ct
- 7843 NE 146th St
- 8713 NE 144th St
- 8708 NE 140th St Unit A
- 14808 84th Ave NE
- 14911 84th Ave NE
- 14132 74th Place NE Unit 16D
- 8801 NE 140th Place
- 14423 75th Ave NE
- 7419 NE 145th St
- 7339 NE 140th St
- 7475 NE 146th St
- 14010 Juanita Dr NE Unit SB4
- 14020 Juanita Dr NE Unit B3
- 9209 NE 142nd Way
- 15031 78th Ave NE
- 15115 78th Ave NE
- 14505 Simonds Rd NE Unit C
- 8226 NE 142nd St
- 8210 NE 142nd St
- 8210 NE 142nd St
- 8305 NE 143rd St
- 8232 NE 142nd St
- 8232 NE 142nd St
- 8227 NE 142nd St
- 14204 82nd Ave NE
- 14142 82nd Place NE
- 14204 82nd Ave NE
- 14142 82nd Place NE
- 14210 82nd Ave NE
- 8227 NE 142nd St
- 14210 82nd Ave NE
- 8311 NE 143rd St
- 8301 NE 143rd St
- 8233 NE 142nd St
- 14216 82nd Ave NE
- 8240 NE 142nd St
- 8205 NE 142nd St
Your Personal Tour Guide
Ask me questions while you tour the home.