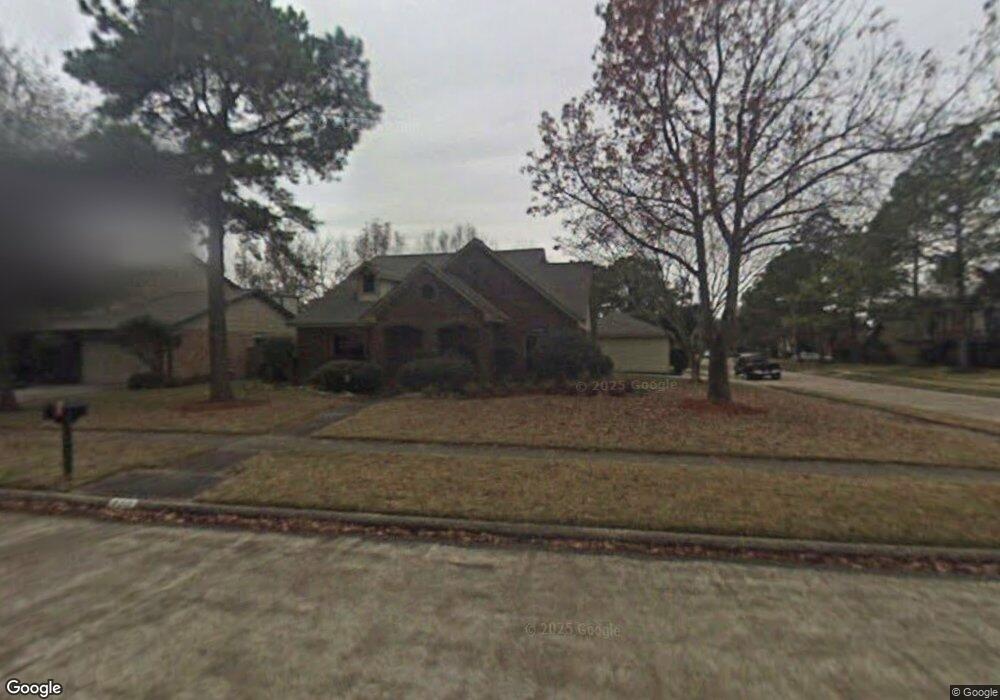
8219 Pine Falls Dr Houston, TX 77095
Copperfield NeighborhoodEstimated Value: $310,000 - $331,000
4
Beds
3
Baths
2,614
Sq Ft
$121/Sq Ft
Est. Value
About This Home
This home is located at 8219 Pine Falls Dr, Houston, TX 77095 and is currently estimated at $316,712, approximately $121 per square foot. 8219 Pine Falls Dr is a home located in Harris County with nearby schools including Fiest Elementary School, Labay Middle School, and Cypress Falls High School.
Ownership History
Date
Name
Owned For
Owner Type
Purchase Details
Closed on
Feb 25, 2020
Sold by
Springer Sharon Divine
Bought by
Chacon Jason and Chacon Kerri
Current Estimated Value
Home Financials for this Owner
Home Financials are based on the most recent Mortgage that was taken out on this home.
Original Mortgage
$181,649
Outstanding Balance
$163,498
Interest Rate
4.4%
Mortgage Type
FHA
Estimated Equity
$153,214
Purchase Details
Closed on
Oct 26, 2006
Sold by
Martini Jeffrey R and Martini Carey Ann
Bought by
Springer Sharon Divine
Home Financials for this Owner
Home Financials are based on the most recent Mortgage that was taken out on this home.
Original Mortgage
$102,800
Interest Rate
6.41%
Mortgage Type
Purchase Money Mortgage
Purchase Details
Closed on
Sep 5, 2000
Sold by
Azra Norbert and Azra Lesa
Bought by
Martini Jeffrey R
Home Financials for this Owner
Home Financials are based on the most recent Mortgage that was taken out on this home.
Original Mortgage
$124,450
Interest Rate
8.15%
Create a Home Valuation Report for This Property
The Home Valuation Report is an in-depth analysis detailing your home's value as well as a comparison with similar homes in the area
Home Values in the Area
Average Home Value in this Area
Purchase History
| Date | Buyer | Sale Price | Title Company |
|---|---|---|---|
| Chacon Jason | -- | Ntx | |
| Springer Sharon Divine | -- | Houston Title Co | |
| Martini Jeffrey R | -- | Startex Title Company |
Source: Public Records
Mortgage History
| Date | Status | Borrower | Loan Amount |
|---|---|---|---|
| Open | Chacon Jason | $181,649 | |
| Previous Owner | Springer Sharon Divine | $102,800 | |
| Previous Owner | Martini Jeffrey R | $124,450 |
Source: Public Records
Tax History Compared to Growth
Tax History
| Year | Tax Paid | Tax Assessment Tax Assessment Total Assessment is a certain percentage of the fair market value that is determined by local assessors to be the total taxable value of land and additions on the property. | Land | Improvement |
|---|---|---|---|---|
| 2025 | $3,756 | $286,873 | $73,165 | $213,708 |
| 2024 | $3,756 | $286,873 | $65,389 | $221,484 |
| 2023 | $3,756 | $297,807 | $65,389 | $232,418 |
| 2022 | $5,411 | $281,764 | $50,191 | $231,573 |
| 2021 | $5,182 | $223,212 | $50,191 | $173,021 |
| 2020 | $5,175 | $217,011 | $41,708 | $175,303 |
| 2019 | $5,052 | $204,706 | $32,871 | $171,835 |
| 2018 | $807 | $191,960 | $32,871 | $159,089 |
| 2017 | $4,403 | $191,960 | $32,871 | $159,089 |
| 2016 | $4,064 | $191,960 | $32,871 | $159,089 |
| 2015 | $1,238 | $185,486 | $32,871 | $152,615 |
| 2014 | $1,238 | $157,842 | $27,569 | $130,273 |
Source: Public Records
Map
Nearby Homes
- 8203 Green Devon Dr
- 8211 Riverglade Dr
- 15611 Meadow Village Dr
- 15339 Glenwood Park Dr
- 15918 Pinyon Creek Dr
- 8526 Greenleaf Lake Dr
- 15415 Swan Creek Dr
- 8526 Hot Springs Dr
- 15414 Swan Creek Dr
- 15362 Meadow Village Dr
- 8306 Lake Crystal Dr
- 15854 Knolls Lodge Dr
- 15634 Haleys Landing Ln
- 15954 Oak Mountain Dr
- 15131 New Hastings Dr
- 15010 Chetland Place Dr
- 15735 Jamie Lee Dr
- 15610 Tarpon Springs Ct
- 8550 Sparkling Springs Dr
- 16026 Autumn Falls Ln
- 8211 Pine Falls Dr
- 8214 Green Devon Dr
- 8210 Green Devon Dr
- 8207 Pine Falls Dr
- 15702 Lakedale Dr
- 15706 Lakedale Dr
- 8206 Green Devon Dr
- 8214 Pine Falls Dr
- 8222 Pine Falls Dr
- 15710 Lakedale Dr
- 8203 Pine Falls Dr
- 8210 Pine Falls Dr
- 8302 Pine Falls Dr
- 15714 Lakedale Dr
- 8202 Green Devon Dr
- 15703 Maple Manor Dr
- 8206 Pine Falls Dr
- 8306 Pine Falls Dr
- 8211 Green Devon Dr
- 15707 Maple Manor Dr