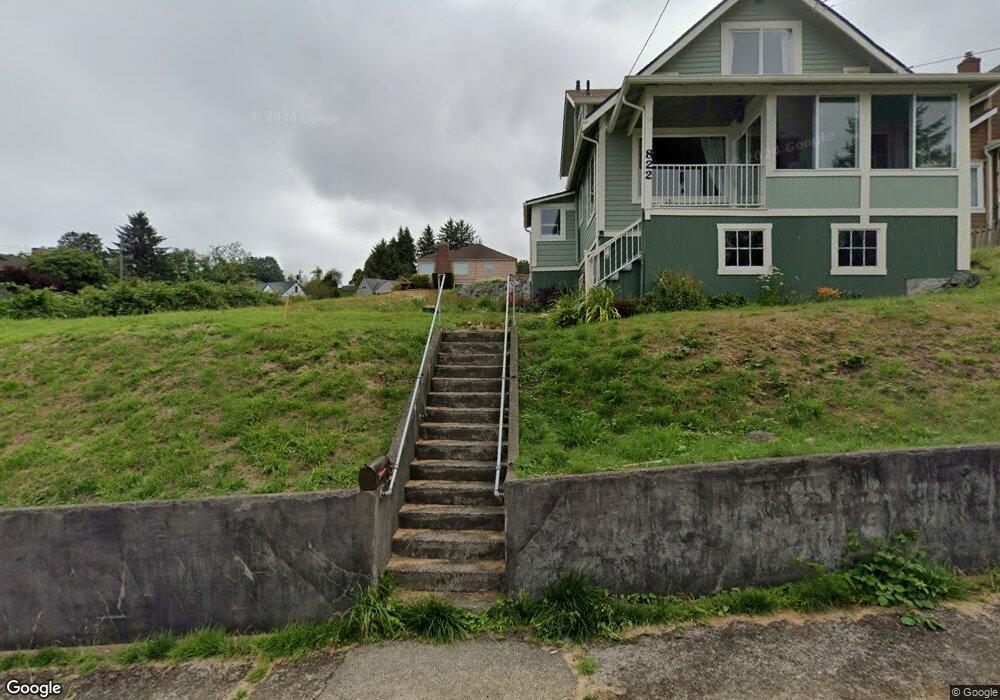
822 35th St Unit 824 Astoria, OR 97103
Estimated Value: $422,000 - $484,000
4
Beds
3
Baths
1,460
Sq Ft
$305/Sq Ft
Est. Value
About This Home
This home is located at 822 35th St Unit 824, Astoria, OR 97103 and is currently estimated at $445,841, approximately $305 per square foot. 822 35th St Unit 824 is a home located in Clatsop County with nearby schools including Astor Elementary School, Lewis & Clark Elementary School, and Astoria Middle School.
Ownership History
Date
Name
Owned For
Owner Type
Purchase Details
Closed on
May 20, 2021
Sold by
Bohne Fred E
Bought by
Ross Jackson Lee and Jackson Lee Ross
Current Estimated Value
Home Financials for this Owner
Home Financials are based on the most recent Mortgage that was taken out on this home.
Original Mortgage
$244,000
Outstanding Balance
$183,510
Interest Rate
3.1%
Mortgage Type
New Conventional
Estimated Equity
$262,331
Create a Home Valuation Report for This Property
The Home Valuation Report is an in-depth analysis detailing your home's value as well as a comparison with similar homes in the area
Home Values in the Area
Average Home Value in this Area
Purchase History
| Date | Buyer | Sale Price | Title Company |
|---|---|---|---|
| Ross Jackson Lee | $45,000 | Ticor Title Company Of Or | |
| Ross Jackson Lee | $305,000 | Ticor Title Company Of Or |
Source: Public Records
Mortgage History
| Date | Status | Borrower | Loan Amount |
|---|---|---|---|
| Open | Ross Jackson Lee | $244,000 |
Source: Public Records
Tax History Compared to Growth
Tax History
| Year | Tax Paid | Tax Assessment Tax Assessment Total Assessment is a certain percentage of the fair market value that is determined by local assessors to be the total taxable value of land and additions on the property. | Land | Improvement |
|---|---|---|---|---|
| 2025 | $2,726 | $136,536 | -- | -- |
| 2024 | $2,653 | $132,560 | -- | -- |
| 2023 | $2,562 | $128,700 | $0 | $0 |
| 2022 | $2,421 | $124,953 | $0 | $0 |
| 2021 | $2,355 | $121,314 | $0 | $0 |
| 2020 | $2,288 | $117,782 | $0 | $0 |
| 2019 | $2,218 | $114,353 | $0 | $0 |
| 2018 | $1,993 | $111,023 | $0 | $0 |
| 2017 | $1,865 | $107,790 | $0 | $0 |
| 2016 | $1,736 | $104,651 | $66,745 | $37,906 |
| 2015 | $1,878 | $104,126 | $67,198 | $36,928 |
| 2014 | $1,844 | $101,094 | $0 | $0 |
| 2013 | -- | $98,150 | $0 | $0 |
Source: Public Records
Map
Nearby Homes
- 824 35th St
- 842 35th St
- 843 35th St
- 0 35th & Harrison
- 3493 Harrison Ave
- 860 35th St
- 3506 Harrison Ave
- 844 35th St
- 3511 Harrison Ave
- 3475 Harrison Ave
- 3496 Harrison Ave
- 3552 Irving Ave
- 863 35th St
- 3591 Harrison Ave
- 3513 Harrison Ave
- 3513 Harrison Dr
- 877 35th St
- 3455 Harrison Ave
- 3468 Harrison Ave
- 896 35th St