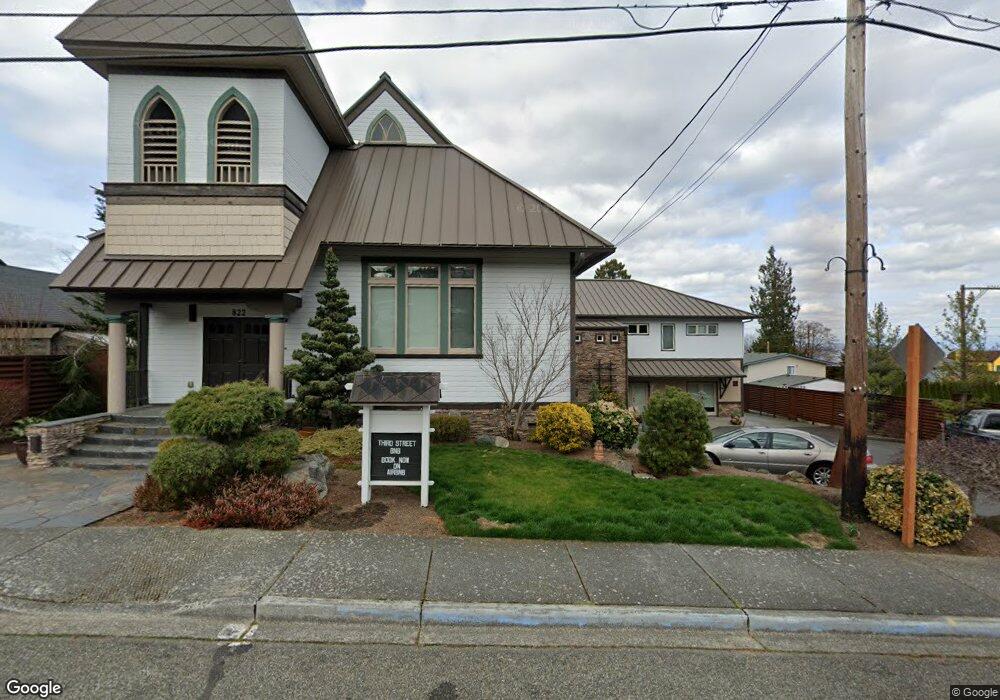
822 3rd St Mukilteo, WA 98275
Old Town Mukilteo NeighborhoodEstimated Value: $1,407,000 - $1,936,000
8
Beds
8
Baths
8,816
Sq Ft
$190/Sq Ft
Est. Value
About This Home
This home is located at 822 3rd St, Mukilteo, WA 98275 and is currently estimated at $1,673,555, approximately $189 per square foot. 822 3rd St is a home located in Snohomish County with nearby schools including Mukilteo Elementary School, Olympic View Middle School, and Kamiak High School.
Ownership History
Date
Name
Owned For
Owner Type
Purchase Details
Closed on
Feb 6, 2024
Sold by
Yeadon Brent A and Yeadon Gayle A
Bought by
Yeadon Family Trust and Yeadon
Current Estimated Value
Purchase Details
Closed on
Dec 27, 2004
Sold by
Mukilteo Presbyterian Church
Bought by
Heerschap Dori
Home Financials for this Owner
Home Financials are based on the most recent Mortgage that was taken out on this home.
Original Mortgage
$400,000
Interest Rate
5.87%
Mortgage Type
Construction
Purchase Details
Closed on
Dec 22, 2004
Sold by
Mukilteo Presbyterian Church
Bought by
Yeadon Brent A and Yeadon Gayle A
Home Financials for this Owner
Home Financials are based on the most recent Mortgage that was taken out on this home.
Original Mortgage
$400,000
Interest Rate
5.87%
Mortgage Type
Construction
Create a Home Valuation Report for This Property
The Home Valuation Report is an in-depth analysis detailing your home's value as well as a comparison with similar homes in the area
Home Values in the Area
Average Home Value in this Area
Purchase History
| Date | Buyer | Sale Price | Title Company |
|---|---|---|---|
| Yeadon Family Trust | $313 | None Listed On Document | |
| Heerschap Dori | $137,719 | Fidelity National Title | |
| Yeadon Brent A | $423,750 | Fidelity National Title |
Source: Public Records
Mortgage History
| Date | Status | Borrower | Loan Amount |
|---|---|---|---|
| Previous Owner | Yeadon Brent A | $400,000 | |
| Closed | Yeadon Brent A | $162,500 |
Source: Public Records
Tax History
| Year | Tax Paid | Tax Assessment Tax Assessment Total Assessment is a certain percentage of the fair market value that is determined by local assessors to be the total taxable value of land and additions on the property. | Land | Improvement |
|---|---|---|---|---|
| 2026 | $10,899 | $1,565,900 | $640,800 | $925,100 |
| 2025 | $10,518 | $1,449,000 | $569,600 | $879,400 |
| 2024 | $10,518 | $1,414,500 | $535,100 | $879,400 |
| 2023 | $10,419 | $1,446,000 | $561,100 | $884,900 |
| 2022 | $8,150 | $970,100 | $391,900 | $578,200 |
| 2020 | $6,835 | $816,800 | $318,500 | $498,300 |
| 2019 | $6,408 | $781,400 | $295,100 | $486,300 |
| 2018 | $6,843 | $725,400 | $289,900 | $435,500 |
| 2017 | $5,934 | $651,300 | $243,300 | $408,000 |
| 2016 | $5,701 | $621,200 | $232,200 | $389,000 |
| 2015 | $5,478 | $537,600 | $208,300 | $329,300 |
| 2013 | $4,599 | $424,400 | $166,300 | $258,100 |
Source: Public Records
Map
Nearby Homes
- 612 Park Ave
- 603 Washington Ave
- 9 XX Webster St
- 607 Webster St
- 701 10th St
- 1028 10th St
- 1443 Scurlock Ln
- 0 Hill St
- 997 Goat Trail Loop Rd
- 3727 Shore Ave
- 3702 W Mukilteo Blvd Unit A
- 1803 19th Dr
- 1902 Clover Place
- 3121 Shore Ave
- 2311 Washington Ave
- 4893 76th St SW Unit E1002
- 4724 Gardner Ave
- 2710 Viewcrest Ave
- 2531 57th St SW
- 7926 46th Ave W
Your Personal Tour Guide
Ask me questions while you tour the home.