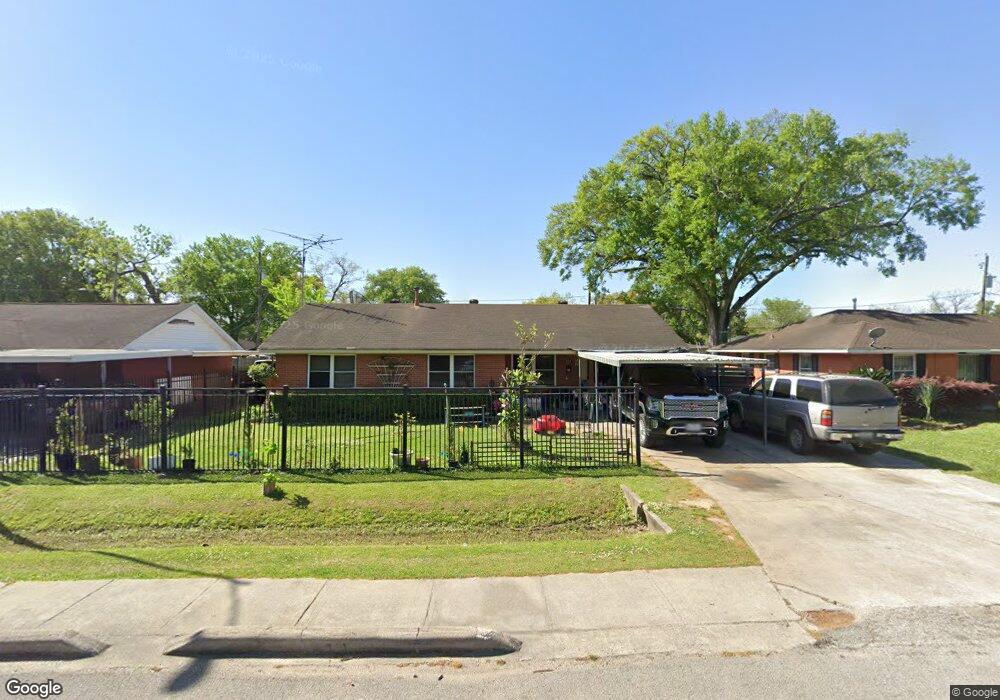
822 Dunham Dr Houston, TX 77076
Northside-Northline NeighborhoodEstimated Value: $186,000 - $199,000
2
Beds
1
Bath
936
Sq Ft
$205/Sq Ft
Est. Value
About This Home
This home is located at 822 Dunham Dr, Houston, TX 77076 and is currently estimated at $191,756, approximately $204 per square foot. 822 Dunham Dr is a home located in Harris County with nearby schools including Northline Elementary School, Fonville Middle School, and Sam Houston Math, Science & Technology Center.
Ownership History
Date
Name
Owned For
Owner Type
Purchase Details
Closed on
Aug 19, 2008
Sold by
Wilson Jacob and Wilson Beatrice
Bought by
Alvarez Nicolas and Alvarez Maria E
Current Estimated Value
Home Financials for this Owner
Home Financials are based on the most recent Mortgage that was taken out on this home.
Original Mortgage
$84,099
Outstanding Balance
$55,440
Interest Rate
6.42%
Mortgage Type
FHA
Estimated Equity
$136,316
Purchase Details
Closed on
Feb 9, 2001
Sold by
Hruby Jean M and Hruby Andy
Bought by
Wilson Jacob and Wilson Beatrice
Home Financials for this Owner
Home Financials are based on the most recent Mortgage that was taken out on this home.
Original Mortgage
$44,646
Interest Rate
7.13%
Mortgage Type
FHA
Purchase Details
Closed on
Nov 16, 1995
Sold by
Brockbank Francis Morgan
Bought by
Burke Marvin Reid and Hruby Andy
Home Financials for this Owner
Home Financials are based on the most recent Mortgage that was taken out on this home.
Original Mortgage
$35,000
Interest Rate
7.36%
Create a Home Valuation Report for This Property
The Home Valuation Report is an in-depth analysis detailing your home's value as well as a comparison with similar homes in the area
Home Values in the Area
Average Home Value in this Area
Purchase History
| Date | Buyer | Sale Price | Title Company |
|---|---|---|---|
| Alvarez Nicolas | -- | First American Title | |
| Wilson Jacob | -- | Stewart Title Company | |
| Burke Marvin Reid | -- | -- |
Source: Public Records
Mortgage History
| Date | Status | Borrower | Loan Amount |
|---|---|---|---|
| Open | Alvarez Nicolas | $84,099 | |
| Previous Owner | Wilson Jacob | $44,646 | |
| Previous Owner | Burke Marvin Reid | $35,000 |
Source: Public Records
Tax History Compared to Growth
Tax History
| Year | Tax Paid | Tax Assessment Tax Assessment Total Assessment is a certain percentage of the fair market value that is determined by local assessors to be the total taxable value of land and additions on the property. | Land | Improvement |
|---|---|---|---|---|
| 2025 | $1,431 | $169,360 | $66,078 | $103,282 |
| 2024 | $1,431 | $183,669 | $66,078 | $117,591 |
| 2023 | $1,431 | $184,675 | $66,078 | $118,597 |
| 2022 | $2,495 | $151,820 | $44,052 | $107,768 |
| 2021 | $2,401 | $127,570 | $44,052 | $83,518 |
| 2020 | $2,268 | $117,071 | $44,052 | $73,019 |
| 2019 | $2,154 | $123,993 | $44,052 | $79,941 |
| 2018 | $1,273 | $77,402 | $29,368 | $48,034 |
| 2017 | $1,825 | $77,402 | $29,368 | $48,034 |
| 2016 | $1,659 | $72,568 | $22,026 | $50,542 |
| 2015 | -- | $67,416 | $22,026 | $45,390 |
| 2014 | -- | $54,231 | $22,026 | $32,205 |
Source: Public Records
Map
Nearby Homes
- 904 Ellena Rd Unit 16
- 615 Ellena Rd
- 5915 Nordling Rd
- 513 Sunnyside St
- 10135 Fulton St
- 10210 Fulton St
- 10202 Fulton St
- 5701 Luna St
- 10041 Fulton St
- 10245 O Donnell Dr
- 515 Foxglove Ln
- 7 Parker Rd Unit 12
- 59 E Sunnyside St
- 401 New Haven Dr
- 9815 Fulton Park Ln
- 411 Stonework Landing Ln
- 11303 Stonework Grove Ln
- 11315 Stonework Grove Ln
- 9813 Fulton Park Ln
- 40 Dipping Ln