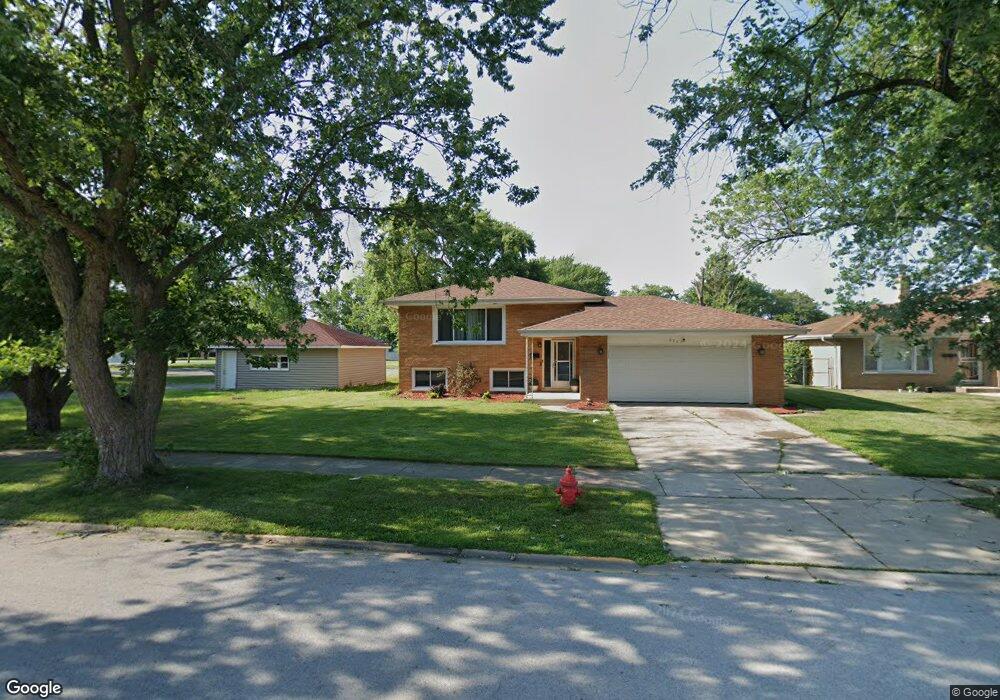
822 E 169th St South Holland, IL 60473
Central District NeighborhoodEstimated Value: $205,000 - $259,000
4
Beds
2
Baths
1,300
Sq Ft
$181/Sq Ft
Est. Value
About This Home
This home is located at 822 E 169th St, South Holland, IL 60473 and is currently estimated at $234,974, approximately $180 per square foot. 822 E 169th St is a home located in Cook County with nearby schools including Greenwood Elementary School, Mckinley Elementary School, and Mckinley Jr High School.
Ownership History
Date
Name
Owned For
Owner Type
Purchase Details
Closed on
Dec 17, 2018
Sold by
Childs Claudel L and Childs Claude L
Bought by
Ptl Family Trust
Current Estimated Value
Purchase Details
Closed on
Mar 2, 2009
Sold by
Accredited Home Lenders Inc
Bought by
Childs Claud L and Childs Velma L
Purchase Details
Closed on
Jul 31, 2008
Sold by
Thompson Danny
Bought by
Accredited Home Lenders Inc
Purchase Details
Closed on
Jan 23, 2001
Sold by
Declaration Sterchele Peter J
Bought by
Thompson Danny and Thompson Kathleen
Home Financials for this Owner
Home Financials are based on the most recent Mortgage that was taken out on this home.
Original Mortgage
$133,015
Interest Rate
7.43%
Mortgage Type
FHA
Purchase Details
Closed on
May 17, 1995
Sold by
Sterchele Peter J and Sterchele John J
Bought by
Sterchele Peter J
Create a Home Valuation Report for This Property
The Home Valuation Report is an in-depth analysis detailing your home's value as well as a comparison with similar homes in the area
Home Values in the Area
Average Home Value in this Area
Purchase History
| Date | Buyer | Sale Price | Title Company |
|---|---|---|---|
| Ptl Family Trust | -- | Chicago Title Insurance Comp | |
| Childs Claud L | $86,000 | None Available | |
| Accredited Home Lenders Inc | -- | None Available | |
| Thompson Danny | $135,000 | -- | |
| Sterchele Peter J | -- | -- |
Source: Public Records
Mortgage History
| Date | Status | Borrower | Loan Amount |
|---|---|---|---|
| Previous Owner | Thompson Danny | $133,015 |
Source: Public Records
Tax History Compared to Growth
Tax History
| Year | Tax Paid | Tax Assessment Tax Assessment Total Assessment is a certain percentage of the fair market value that is determined by local assessors to be the total taxable value of land and additions on the property. | Land | Improvement |
|---|---|---|---|---|
| 2024 | $9,655 | $21,000 | $3,957 | $17,043 |
| 2023 | $7,852 | $21,000 | $3,957 | $17,043 |
| 2022 | $7,852 | $13,306 | $3,418 | $9,888 |
| 2021 | $7,541 | $13,305 | $3,417 | $9,888 |
| 2020 | $7,112 | $13,305 | $3,417 | $9,888 |
| 2019 | $7,328 | $13,423 | $2,878 | $10,545 |
| 2018 | $6,997 | $13,423 | $2,878 | $10,545 |
| 2017 | $6,840 | $13,423 | $2,878 | $10,545 |
| 2016 | $6,497 | $13,087 | $2,698 | $10,389 |
| 2015 | $6,288 | $13,087 | $2,698 | $10,389 |
| 2014 | $6,132 | $13,087 | $2,698 | $10,389 |
| 2013 | $6,088 | $14,078 | $2,698 | $11,380 |
Source: Public Records
Map
Nearby Homes
- 811 E 169th Place
- 16921 Ingleside Ave
- 947 E 169th St
- 16927 Langley Ave
- 739 E 170th St
- 16664 Maryland Ave
- 16901 School St
- 16645 Cottage Grove Ave
- 16646 Maryland Ave
- 949 E 170th St
- 16856 School St
- 16850 School St
- 16631 Langley Ave
- 16914 Parkside Ave
- 17060 Evans Dr
- 554 E 168th Place
- 16639 Dobson Ave
- 17148 Evans Dr
- 17006 University Ave
- 16656 Woodlawn East Ct
- 828 E 169th St
- 16805 Cottage Grove Ave
- 834 E 169th St
- 825 E 169th St
- 16901 Cottage Grove Ave
- 831 E 169th St
- 842 E 169th St
- 839 E 169th St
- 16773 Cottage Grove Ave
- 848 E 169th St
- 830 E 169th Place
- 820 E 169th Place
- 810 E 169th Place
- 845 E 169th St
- 16822 Cottage Grove Ave
- 800 E 169th Place
- 840 E 169th Place
- 856 E 169th St
- 16840 Cottage Grove Ave
- 16840 Cottage Grove Ave