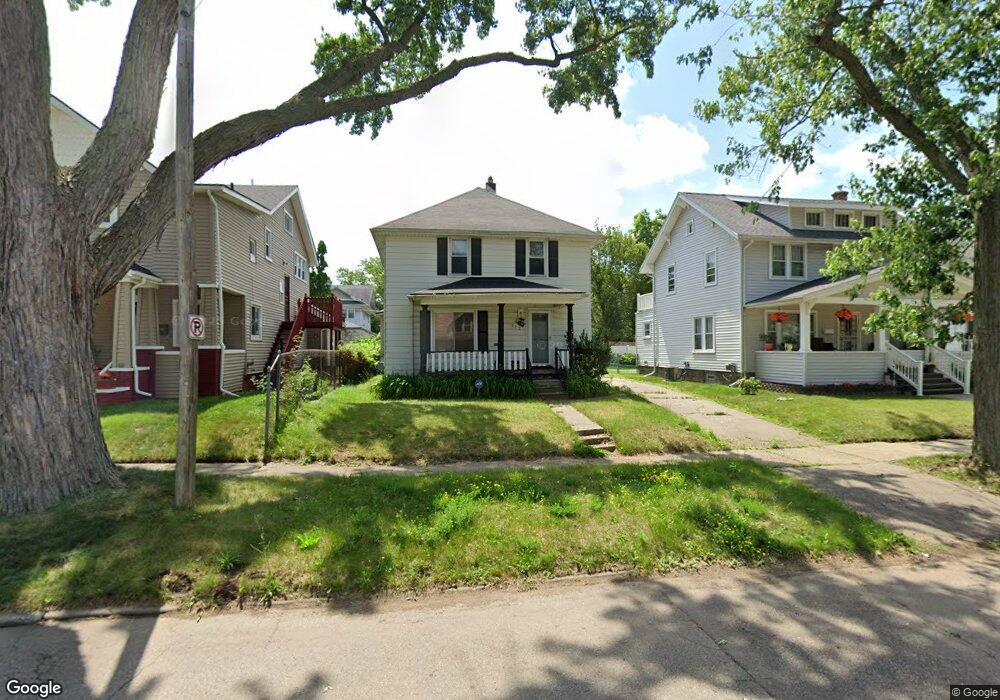
822 E 8th St Flint, MI 48503
Central Park-Fairfield Village NeighborhoodEstimated Value: $95,000 - $121,000
4
Beds
2
Baths
1,514
Sq Ft
$72/Sq Ft
Est. Value
About This Home
This home is located at 822 E 8th St, Flint, MI 48503 and is currently estimated at $108,347, approximately $71 per square foot. 822 E 8th St is a home located in Genesee County with nearby schools including Pierce Elementary School, Flint Southwestern Classical Academy, and Flint Cultural Center Academy.
Ownership History
Date
Name
Owned For
Owner Type
Purchase Details
Closed on
Apr 13, 2022
Sold by
Nathan Bell
Bought by
Ashman Bell Investments
Current Estimated Value
Purchase Details
Closed on
Apr 20, 2007
Sold by
Allen Parks Karen and Parks Jerome
Bought by
Wells Fargo Bank Na and First Franklin Mortgage Loan Trust 2002-
Purchase Details
Closed on
Jul 20, 2000
Sold by
Wittenberg Wittenberg J and Wittenberg Henri
Bought by
Bonnylen Williams Irrevocable Trust
Home Financials for this Owner
Home Financials are based on the most recent Mortgage that was taken out on this home.
Original Mortgage
$61,150
Interest Rate
8.24%
Mortgage Type
FHA
Purchase Details
Closed on
Jul 19, 2000
Sold by
Wittenberg Henri and Wittenberg Timothy T
Bought by
Allen Parks Karen
Home Financials for this Owner
Home Financials are based on the most recent Mortgage that was taken out on this home.
Original Mortgage
$61,150
Interest Rate
8.24%
Mortgage Type
FHA
Create a Home Valuation Report for This Property
The Home Valuation Report is an in-depth analysis detailing your home's value as well as a comparison with similar homes in the area
Home Values in the Area
Average Home Value in this Area
Purchase History
| Date | Buyer | Sale Price | Title Company |
|---|---|---|---|
| Ashman Bell Investments | -- | None Listed On Document | |
| Wells Fargo Bank Na | $96,836 | None Available | |
| Bonnylen Williams Irrevocable Trust | -- | Philip F Greco Title Company | |
| Allen Parks Karen | $61,250 | Greco Title |
Source: Public Records
Mortgage History
| Date | Status | Borrower | Loan Amount |
|---|---|---|---|
| Previous Owner | Allen Parks Karen | $61,150 |
Source: Public Records
Tax History
| Year | Tax Paid | Tax Assessment Tax Assessment Total Assessment is a certain percentage of the fair market value that is determined by local assessors to be the total taxable value of land and additions on the property. | Land | Improvement |
|---|---|---|---|---|
| 2025 | $2,224 | $45,400 | $0 | $0 |
| 2024 | $2,036 | $32,400 | $0 | $0 |
| 2023 | $1,970 | $26,100 | $0 | $0 |
| 2022 | $0 | $18,100 | $0 | $0 |
| 2021 | $1,192 | $14,100 | $0 | $0 |
| 2020 | $1,093 | $13,800 | $0 | $0 |
| 2019 | $1,066 | $12,800 | $0 | $0 |
| 2018 | $1,064 | $13,500 | $0 | $0 |
| 2017 | $1,036 | $0 | $0 | $0 |
| 2016 | $1,028 | $0 | $0 | $0 |
| 2015 | -- | $0 | $0 | $0 |
| 2014 | -- | $0 | $0 | $0 |
| 2012 | -- | $15,800 | $0 | $0 |
Source: Public Records
Map
Nearby Homes
- 915 E 8th St
- 911 E 7th St
- 1701 Park St
- 915 E Court St Unit 104
- 915 E Court St
- 915 E Court #206 St Unit 206
- 1720 Park St
- 410 E 4th St
- 407 E 12th St
- A Avenue
- 621 Pierson St
- 314 E 4th St
- 1210 Blanchard Ave
- 211 W 5th St
- 1510 S Franklin Ave
- 638 Maxine St
- 2010 Crocker Ave
- 2050 Ferris Ave
- 1114 S Grand Traverse St
- 1215 S Grand Traverse St
Your Personal Tour Guide
Ask me questions while you tour the home.