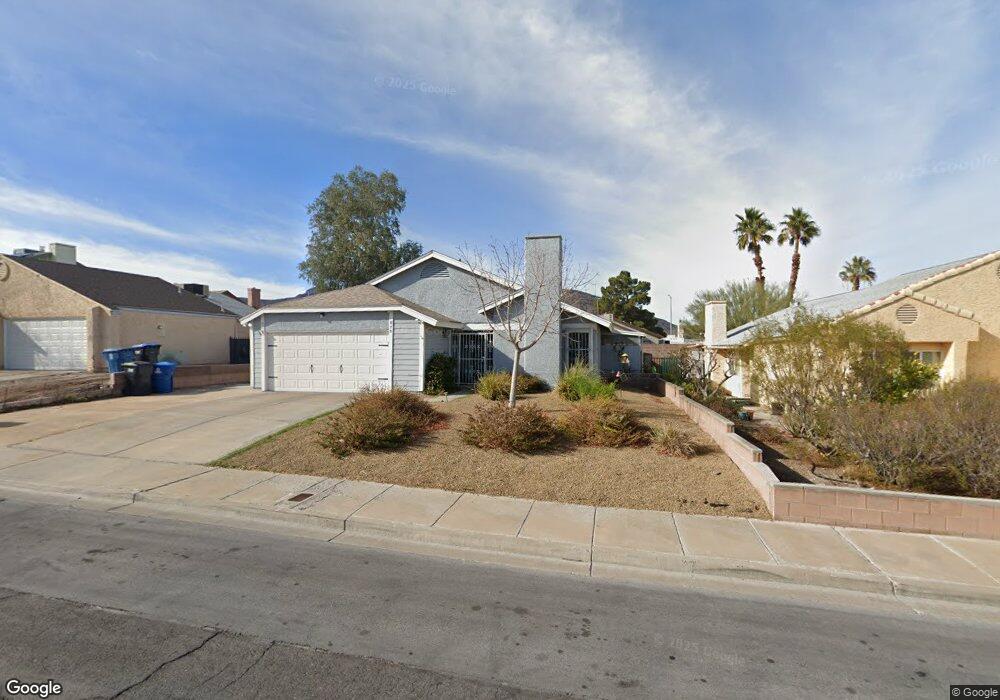
822 Fireweed Dr Unit 1 Henderson, NV 89002
Highland Hills NeighborhoodEstimated Value: $211,000 - $331,000
3
Beds
2
Baths
1,144
Sq Ft
$253/Sq Ft
Est. Value
About This Home
This home is located at 822 Fireweed Dr Unit 1, Henderson, NV 89002 and is currently estimated at $289,000, approximately $252 per square foot. 822 Fireweed Dr Unit 1 is a home located in Clark County with nearby schools including Fay Galloway Elementary School, Jack & Terry Mannion Middle School, and Foothill High School.
Ownership History
Date
Name
Owned For
Owner Type
Purchase Details
Closed on
Dec 23, 2010
Sold by
Campbell Kathy L
Bought by
Negri Joseph L
Current Estimated Value
Home Financials for this Owner
Home Financials are based on the most recent Mortgage that was taken out on this home.
Original Mortgage
$87,718
Outstanding Balance
$58,306
Interest Rate
4.34%
Mortgage Type
FHA
Estimated Equity
$230,694
Purchase Details
Closed on
Jun 12, 2010
Sold by
Campbell Robert James and Campbell Kathy L
Bought by
Campbell Kathy L
Purchase Details
Closed on
Jan 11, 2006
Sold by
Pauline H Seeliger Revocable Trust
Bought by
Karns Kathy L
Home Financials for this Owner
Home Financials are based on the most recent Mortgage that was taken out on this home.
Original Mortgage
$100,000
Interest Rate
6.25%
Mortgage Type
Fannie Mae Freddie Mac
Purchase Details
Closed on
Oct 13, 2003
Sold by
Seeliger Pauline H
Bought by
Seeliger Pauline H and The Pauline H Seeliger Revocable Trust
Create a Home Valuation Report for This Property
The Home Valuation Report is an in-depth analysis detailing your home's value as well as a comparison with similar homes in the area
Home Values in the Area
Average Home Value in this Area
Purchase History
| Date | Buyer | Sale Price | Title Company |
|---|---|---|---|
| Negri Joseph L | $90,000 | North American Title Main | |
| Campbell Kathy L | -- | None Available | |
| Karns Kathy L | $125,000 | Fidelity National Title | |
| Seeliger Pauline H | -- | -- |
Source: Public Records
Mortgage History
| Date | Status | Borrower | Loan Amount |
|---|---|---|---|
| Open | Negri Joseph L | $87,718 | |
| Previous Owner | Karns Kathy L | $100,000 |
Source: Public Records
Tax History Compared to Growth
Tax History
| Year | Tax Paid | Tax Assessment Tax Assessment Total Assessment is a certain percentage of the fair market value that is determined by local assessors to be the total taxable value of land and additions on the property. | Land | Improvement |
|---|---|---|---|---|
| 2025 | $927 | $53,874 | $24,500 | $29,374 |
| 2024 | $900 | $53,874 | $24,500 | $29,374 |
| 2023 | $900 | $60,596 | $31,850 | $28,746 |
| 2022 | $874 | $51,933 | $25,200 | $26,733 |
| 2021 | $849 | $48,207 | $22,400 | $25,807 |
| 2020 | $821 | $46,570 | $20,650 | $25,920 |
| 2019 | $797 | $44,412 | $18,550 | $25,862 |
| 2018 | $774 | $40,699 | $15,400 | $25,299 |
| 2017 | $1,138 | $39,276 | $13,300 | $25,976 |
| 2016 | $734 | $35,378 | $8,750 | $26,628 |
| 2015 | $732 | $31,619 | $8,750 | $22,869 |
| 2014 | $712 | $24,308 | $5,775 | $18,533 |
Source: Public Records
Map
Nearby Homes
- 860 Bergamont Dr
- 815 Crabapple Dr
- 322 Wintercress Dr
- 854 Coral Cottage Dr
- 307 Balsa St
- 503 Credence Ave
- 805 Lupine Ct
- 710 Greenway Rd
- 709 Greenway Rd
- 533 Calypso Dr
- 633 Severn St
- 692 Skyline Rd
- 722 Barrie Ct
- 131 Park Ridge Ln
- 385 Cove Ct Unit 2
- 128 Rancho Maderas Way
- 132 Westin Ln
- 104 Appian Way
- 419 Chateau Dr
- 1028 Twin Berry Ct
- 824 Fireweed Dr Unit 1
- 820 Fireweed Dr
- 819 Spikenard Dr
- 821 Spikenard Dr
- 818 Fireweed Dr
- 826 Fireweed Dr
- 817 Spikenard Dr
- 823 Spikenard Dr
- 329 Bunchberry Ct
- 328 Bunchberry Ct
- 815 Spikenard Dr
- 816 Fireweed Dr
- 828 Fireweed Dr
- 825 Spikenard Dr
- 331 Bunchberry Ct
- 813 Spikenard Dr Unit 1
- 817 Fireweed Dr
- 814 Fireweed Dr
- 830 Fireweed Dr
- 331 Quince Ct