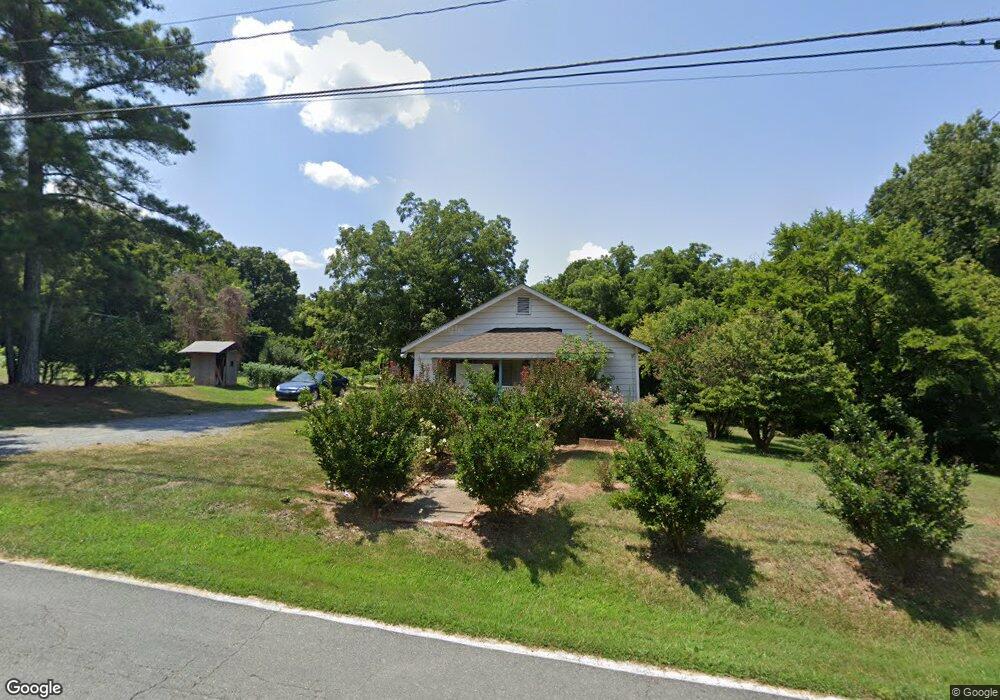
822 Maurice St Monroe, NC 28112
Estimated Value: $112,000 - $216,000
2
Beds
1
Bath
972
Sq Ft
$167/Sq Ft
Est. Value
About This Home
This home is located at 822 Maurice St, Monroe, NC 28112 and is currently estimated at $161,847, approximately $166 per square foot. 822 Maurice St is a home located in Union County with nearby schools including East Elementary School, Monroe Middle School, and Monroe High School.
Ownership History
Date
Name
Owned For
Owner Type
Purchase Details
Closed on
Mar 9, 2022
Sold by
Harkey James C and Harkey Tenley S
Bought by
Ramirez-Ayala Micaela
Current Estimated Value
Purchase Details
Closed on
May 30, 2018
Sold by
Ramirez Ayala Javier and Flores Sirce Viridian Sanchez
Bought by
Ramirez Ayala Micaela
Purchase Details
Closed on
Dec 11, 2015
Sold by
Harkey James C and Harkey Tenley S
Bought by
Ramirez Ayala Jaiver and Sanchez Flores Sirce Viridian
Home Financials for this Owner
Home Financials are based on the most recent Mortgage that was taken out on this home.
Original Mortgage
$48,000
Interest Rate
7%
Purchase Details
Closed on
Jul 29, 2015
Sold by
Bolden Bolden Kim Kim and Bolden Caldwell Kathy
Bought by
Harkey James C
Purchase Details
Closed on
Jul 7, 2015
Sold by
Mcgill Kamesha Renee
Bought by
Bolden Bolden Kim Kim and Bolden Caldwell Kathy
Create a Home Valuation Report for This Property
The Home Valuation Report is an in-depth analysis detailing your home's value as well as a comparison with similar homes in the area
Home Values in the Area
Average Home Value in this Area
Purchase History
| Date | Buyer | Sale Price | Title Company |
|---|---|---|---|
| Ramirez-Ayala Micaela | $48,500 | Chicago Title | |
| Ramirez Ayala Micaela | $48,500 | None Available | |
| Ramirez Ayala Jaiver | $48,500 | None Available | |
| Harkey James C | $35,000 | Attorney | |
| Bolden Bolden Kim Kim | -- | Chicago Title Insurance Co |
Source: Public Records
Mortgage History
| Date | Status | Borrower | Loan Amount |
|---|---|---|---|
| Previous Owner | Ramirez Ayala Jaiver | $48,000 |
Source: Public Records
Tax History Compared to Growth
Tax History
| Year | Tax Paid | Tax Assessment Tax Assessment Total Assessment is a certain percentage of the fair market value that is determined by local assessors to be the total taxable value of land and additions on the property. | Land | Improvement |
|---|---|---|---|---|
| 2024 | $763 | $70,000 | $32,100 | $37,900 |
| 2023 | $763 | $70,000 | $32,100 | $37,900 |
| 2022 | $763 | $70,000 | $32,100 | $37,900 |
| 2021 | $763 | $70,000 | $32,100 | $37,900 |
| 2020 | $552 | $40,950 | $15,850 | $25,100 |
| 2019 | $552 | $40,950 | $15,850 | $25,100 |
| 2018 | $253 | $40,950 | $15,850 | $25,100 |
| 2017 | $561 | $41,000 | $15,900 | $25,100 |
| 2016 | $555 | $40,950 | $15,850 | $25,100 |
| 2015 | $318 | $40,950 | $15,850 | $25,100 |
| 2014 | $588 | $48,220 | $19,490 | $28,730 |
Source: Public Records
Map
Nearby Homes
- 707 Summit St
- 922 Maurice St
- 806 Colony Oaks Dr
- 1023 Parker St
- 0 Labon St
- 1022 Parker St
- 207 Maurice St
- 802 E Franklin St
- 810 E Franklin St
- 303 Lancaster Ave
- 301 E Windsor St
- 705 Lancaster Ave
- 203 Raymond St
- 111 S Washington St
- 1202 E Franklin St
- 615 W Park Dr
- 211 Ridgewood Dr
- 913 Winchester Ave
- 1111 Keswick Place Unit 13
- 1116 Medlin Rd
- 819 Maurice St
- 826 Maurice St
- 821 Maurice St
- 824 Maurice St
- 823 Maurice St
- 402 E Sunset Dr
- 825 Maurice St
- 401 E Sunset Dr
- 405 E Sunset Dr
- 321 E Sunset Dr
- 406 E Sunset Dr
- 403 E Sunset Dr
- 802 Crystal Ln
- 804 Crystal Ln
- 829 Maurice St
- 817 Valley Creek Dr
- 820 Valley Creek Dr
- 806 Crystal Ln
- 831 Maurice St
- 801 Crystal Ln