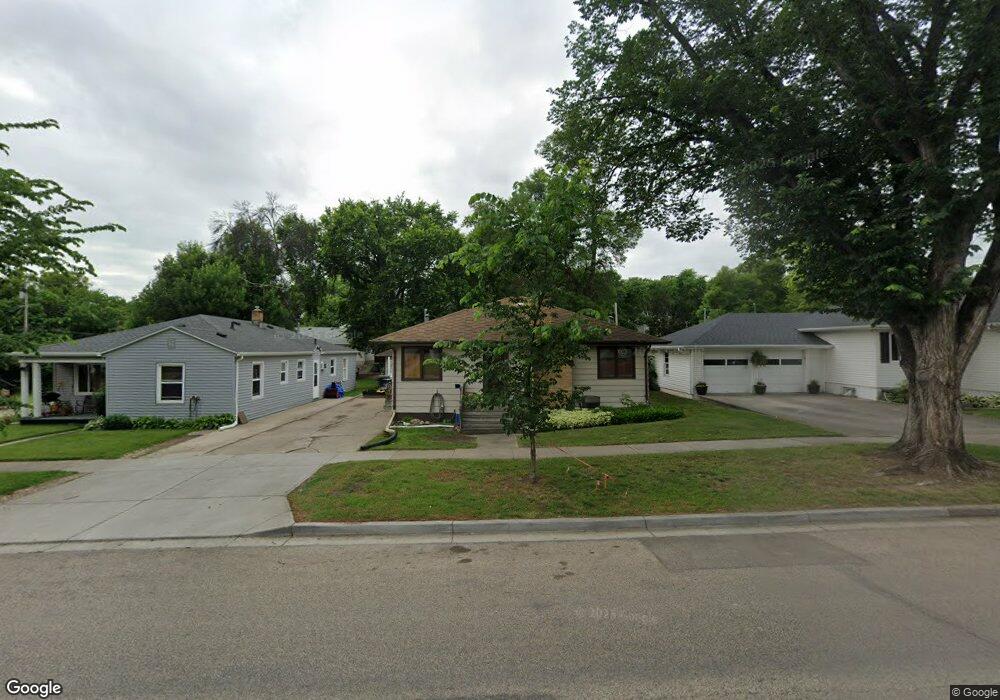
822 N 3rd St Bismarck, ND 58501
Capital District NeighborhoodEstimated Value: $240,000 - $279,000
2
Beds
2
Baths
1,152
Sq Ft
$225/Sq Ft
Est. Value
About This Home
This home is located at 822 N 3rd St, Bismarck, ND 58501 and is currently estimated at $258,726, approximately $224 per square foot. 822 N 3rd St is a home located in Burleigh County with nearby schools including Will-Moore Elementary School, Wachter Middle School, and Bismarck High School.
Ownership History
Date
Name
Owned For
Owner Type
Purchase Details
Closed on
Aug 20, 2007
Sold by
Speidel Marvin and Speidel Ruth
Bought by
Speidel Marvin and Speidel Ruth
Current Estimated Value
Home Financials for this Owner
Home Financials are based on the most recent Mortgage that was taken out on this home.
Original Mortgage
$202,500
Outstanding Balance
$119,319
Interest Rate
5.78%
Mortgage Type
Reverse Mortgage Home Equity Conversion Mortgage
Estimated Equity
$139,407
Purchase Details
Closed on
Jun 29, 2007
Sold by
Speidel Larry J
Bought by
Speidel Marvin O and Speidel Ruth
Home Financials for this Owner
Home Financials are based on the most recent Mortgage that was taken out on this home.
Original Mortgage
$202,500
Outstanding Balance
$119,319
Interest Rate
5.78%
Mortgage Type
Reverse Mortgage Home Equity Conversion Mortgage
Estimated Equity
$139,407
Create a Home Valuation Report for This Property
The Home Valuation Report is an in-depth analysis detailing your home's value as well as a comparison with similar homes in the area
Home Values in the Area
Average Home Value in this Area
Purchase History
| Date | Buyer | Sale Price | Title Company |
|---|---|---|---|
| Speidel Marvin | -- | -- | |
| Speidel Marvin O | -- | -- |
Source: Public Records
Mortgage History
| Date | Status | Borrower | Loan Amount |
|---|---|---|---|
| Open | Speidel Marvin | $202,500 |
Source: Public Records
Tax History
| Year | Tax Paid | Tax Assessment Tax Assessment Total Assessment is a certain percentage of the fair market value that is determined by local assessors to be the total taxable value of land and additions on the property. | Land | Improvement |
|---|---|---|---|---|
| 2025 | $3,014 | $118,450 | $25,000 | $93,450 |
| 2024 | $3,108 | $110,500 | $20,000 | $90,500 |
| 2023 | $761 | $110,500 | $20,000 | $90,500 |
| 2022 | $2,709 | $100,250 | $20,000 | $80,250 |
| 2021 | $2,726 | $94,500 | $19,000 | $75,500 |
| 2020 | $1,285 | $94,500 | $19,000 | $75,500 |
| 2019 | $1,087 | $90,450 | $0 | $0 |
| 2018 | $565 | $90,450 | $19,000 | $71,450 |
| 2017 | $529 | $90,450 | $19,000 | $71,450 |
| 2016 | $529 | $90,450 | $14,000 | $76,450 |
| 2014 | -- | $80,500 | $0 | $0 |
Source: Public Records
Map
Nearby Homes
- 314 C Ave E
- 702 N 4th St
- 205 E Avenue C
- 1014 N 5th St
- 1025 N 4th St
- 602 N 3rd St
- 930 N 6th St
- 413 B E
- 103 W Avenue A Unit 3
- 121 Sioux Ave
- 111 Seminole Ave
- 1000 N 9th St
- 921 N 9th St
- 909 East Ave E
- 1015 N 9th St
- 100 W Broadway Ave Unit 304
- 209 W Thayer Ave Unit C
- 215 W Thayer Ave
- 1002 F Ave E
- 1306 N 4th St Unit 102
Your Personal Tour Guide
Ask me questions while you tour the home.