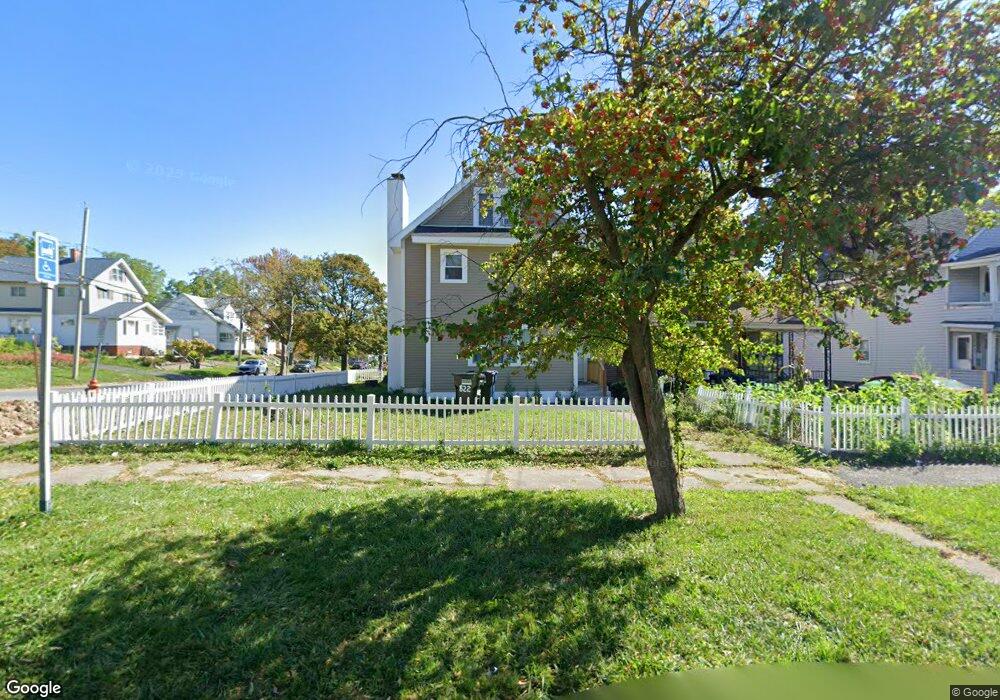
822 Pond St Syracuse, NY 13208
Northside NeighborhoodEstimated Value: $112,000 - $204,073
6
Beds
2
Baths
2,208
Sq Ft
$66/Sq Ft
Est. Value
About This Home
This home is located at 822 Pond St, Syracuse, NY 13208 and is currently estimated at $146,268, approximately $66 per square foot. 822 Pond St is a home located in Onondaga County with nearby schools including Webster Elementary School, Grant Middle School, and Henninger High School.
Ownership History
Date
Name
Owned For
Owner Type
Purchase Details
Closed on
Sep 29, 2023
Sold by
Thuynh-Pham Thuy L
Bought by
Thuy Loan T Pham Irt and Huynh
Current Estimated Value
Purchase Details
Closed on
May 5, 2023
Sold by
Pham Kevin
Bought by
Pham Loan
Purchase Details
Closed on
Feb 25, 2021
Sold by
Kk & Bb Investment Llc
Bought by
Pham Loan T
Purchase Details
Closed on
Oct 14, 2020
Sold by
Hsbc Bank Usa Na
Bought by
Pham Kevin
Purchase Details
Closed on
Jun 13, 2014
Sold by
Hoyt Aaron
Bought by
Hsbc Bank Usa N A
Purchase Details
Closed on
Jan 17, 2006
Sold by
Federal Home Loan Mortgage Corporation
Bought by
Hoyt Nicole and Hoyt Arron M
Purchase Details
Closed on
Jan 4, 2005
Sold by
Kennedy John A
Bought by
Federal Home Loan Mortgage Corporation
Create a Home Valuation Report for This Property
The Home Valuation Report is an in-depth analysis detailing your home's value as well as a comparison with similar homes in the area
Home Values in the Area
Average Home Value in this Area
Purchase History
| Date | Buyer | Sale Price | Title Company |
|---|---|---|---|
| Thuy Loan T Pham Irt | -- | None Available | |
| Pham Loan | -- | None Available | |
| Pham Loan T | $50,000 | None Available | |
| Pham Loan T | $50,000 | None Available | |
| Pham Kevin | $61,000 | None Available | |
| Pham Kevin | $61,000 | None Available | |
| Hsbc Bank Usa N A | $93,500 | -- | |
| Hoyt Nicole | $55,000 | -- | |
| Federal Home Loan Mortgage Corporation | $500 | -- |
Source: Public Records
Tax History Compared to Growth
Tax History
| Year | Tax Paid | Tax Assessment Tax Assessment Total Assessment is a certain percentage of the fair market value that is determined by local assessors to be the total taxable value of land and additions on the property. | Land | Improvement |
|---|---|---|---|---|
| 2024 | -- | $80,000 | $9,500 | $70,500 |
| 2023 | $1,564 | $80,000 | $9,500 | $70,500 |
| 2022 | $1,593 | $80,000 | $9,500 | $70,500 |
| 2021 | $1,593 | $80,000 | $9,500 | $70,500 |
| 2020 | $1,661 | $80,000 | $9,500 | $70,500 |
| 2019 | $3,843 | $80,000 | $9,500 | $70,500 |
| 2018 | $1,658 | $80,000 | $9,500 | $70,500 |
| 2017 | $1,594 | $80,000 | $9,500 | $70,500 |
| 2016 | $1,618 | $80,000 | $9,500 | $70,500 |
| 2015 | -- | $80,000 | $9,500 | $70,500 |
| 2014 | -- | $80,000 | $9,500 | $70,500 |
Source: Public Records
Map
Nearby Homes
- 404 Griffiths St
- 131 Delong Ave
- 106 Culbert St
- 111 Lawrence St
- 900 1st St N
- 809 1st St N
- 117 Lawrence St
- 301 1st St N
- 812 Kirkpatrick St
- 908 1st North St
- 2363 Grant Blvd
- 1417 Butternut St
- 1227 Highland St
- 809 E Division St
- 108 Hartley St
- 410 John St
- 1030 Danforth St
- 1024 Danforth St
- 517 Carbon St
- 505 Carbon St