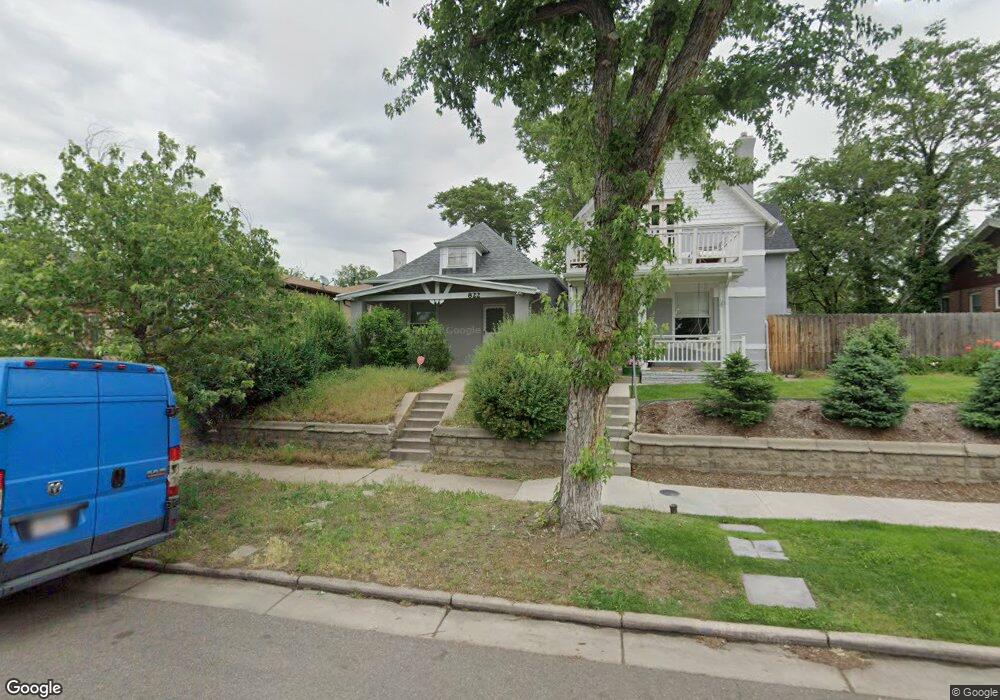
822 S Sherman St Denver, CO 80209
Washington Park West NeighborhoodEstimated Value: $548,225 - $655,000
2
Beds
1
Bath
873
Sq Ft
$698/Sq Ft
Est. Value
About This Home
This home is located at 822 S Sherman St, Denver, CO 80209 and is currently estimated at $609,556, approximately $698 per square foot. 822 S Sherman St is a home located in Denver County with nearby schools including Lincoln Elementary School, Grant Beacon Middle School, and South High School.
Create a Home Valuation Report for This Property
The Home Valuation Report is an in-depth analysis detailing your home's value as well as a comparison with similar homes in the area
Home Values in the Area
Average Home Value in this Area
Tax History Compared to Growth
Tax History
| Year | Tax Paid | Tax Assessment Tax Assessment Total Assessment is a certain percentage of the fair market value that is determined by local assessors to be the total taxable value of land and additions on the property. | Land | Improvement |
|---|---|---|---|---|
| 2024 | $2,078 | $32,940 | $10,660 | $22,280 |
| 2023 | $2,033 | $32,940 | $10,660 | $22,280 |
| 2022 | $1,504 | $25,860 | $14,880 | $10,980 |
| 2021 | $1,452 | $26,610 | $15,310 | $11,300 |
| 2020 | $1,251 | $24,010 | $14,210 | $9,800 |
| 2019 | $1,216 | $24,010 | $14,210 | $9,800 |
| 2018 | $1,300 | $24,000 | $12,110 | $11,890 |
| 2017 | $1,296 | $24,000 | $12,110 | $11,890 |
| 2016 | $1,863 | $22,850 | $10,953 | $11,897 |
| 2015 | $1,785 | $22,850 | $10,953 | $11,897 |
| 2014 | $1,568 | $18,880 | $6,591 | $12,289 |
Source: Public Records
Map
Nearby Homes
- 827 S Sherman St
- 838 S Sherman St
- 130 E Ohio Ave Unit 140
- 857 S Grant St
- 747 S Sherman St
- 873 S Logan St
- 730 S Sherman St
- 646 S Lincoln St
- 1001 S Pennsylvania St Unit 1005
- 969 S Pearl St Unit 204
- 760 S Pearl St
- 623 S Logan St
- 571 S Sherman St
- 912 S Washington St
- 569 S Sherman St
- 1145 S Logan St
- 1160 S Sherman St
- 641 S Washington St
- 995 S Clarkson St
- 732 S Clarkson St
- 816 S Sherman St
- 820 S Sherman St
- 820 S Sherman St
- 816 S Sherman St Unit 1
- 824 S Sherman St
- 814 S Sherman St
- 806 S Sherman St
- 844 S Sherman St
- 802 S Sherman St
- 800 S Sherman St
- 829 S Sherman St
- 817 S Sherman St
- 860 S Sherman St
- 835 S Sherman St
- 845 S Sherman St
- 815 S Grant St
- 829 S Grant St
- 821 S Grant St
- 864 S Sherman St
- 837 S Grant St