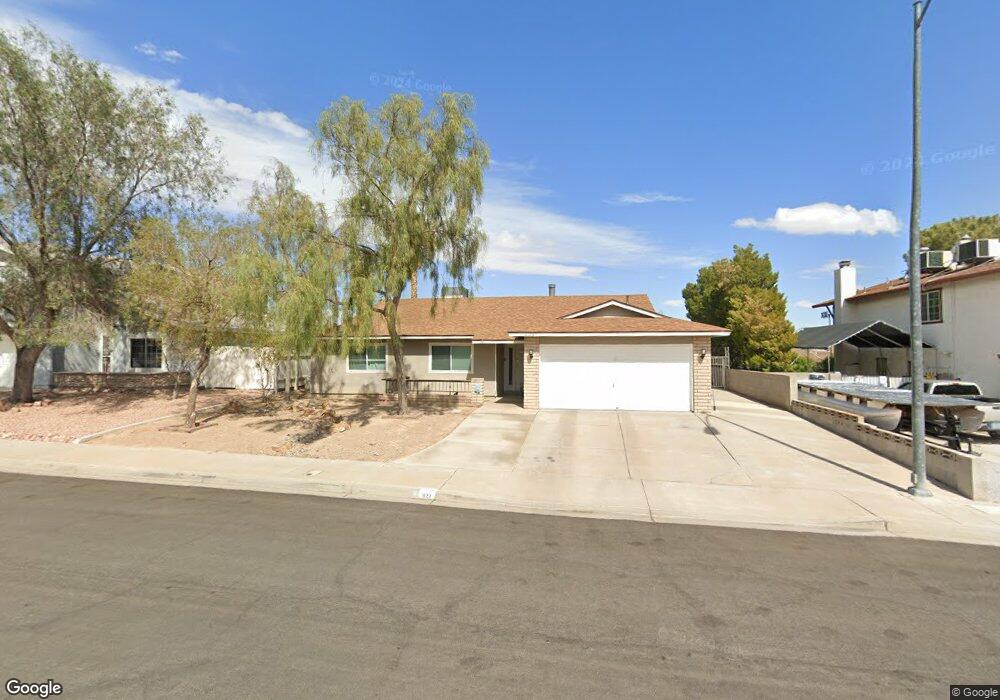
822 Shoreview Dr Henderson, NV 89002
Highland Hills NeighborhoodEstimated Value: $409,000 - $448,000
3
Beds
2
Baths
1,615
Sq Ft
$265/Sq Ft
Est. Value
About This Home
This home is located at 822 Shoreview Dr, Henderson, NV 89002 and is currently estimated at $428,217, approximately $265 per square foot. 822 Shoreview Dr is a home located in Clark County with nearby schools including Fay Galloway Elementary School, Jack & Terry Mannion Middle School, and Foothill High School.
Ownership History
Date
Name
Owned For
Owner Type
Purchase Details
Closed on
Jul 30, 2024
Sold by
Tricon Sfr 2024-3 Equity Owner Llc
Bought by
Tricon Sfr 2024-3 Borrower Llc
Current Estimated Value
Purchase Details
Closed on
Aug 1, 2014
Sold by
Sby 2014 1 Equity Owner Llc
Bought by
Sby 2014 1 Broower Llc
Purchase Details
Closed on
Oct 31, 2012
Sold by
Schultz Christopher J and Schultz Jennifer A
Bought by
2012 B Property Holdings Llc
Purchase Details
Closed on
Mar 1, 2006
Sold by
Cogeshall Sherry L and Cogeshall James K
Bought by
Schultz Christopher J and Schultz Jennifer A
Home Financials for this Owner
Home Financials are based on the most recent Mortgage that was taken out on this home.
Original Mortgage
$273,580
Interest Rate
4.87%
Mortgage Type
Unknown
Purchase Details
Closed on
Mar 24, 2003
Sold by
Cogeshall James K and Cogeshall Sherry L
Bought by
Cogeshall Sherry L and Cogeshall James K
Create a Home Valuation Report for This Property
The Home Valuation Report is an in-depth analysis detailing your home's value as well as a comparison with similar homes in the area
Home Values in the Area
Average Home Value in this Area
Purchase History
| Date | Buyer | Sale Price | Title Company |
|---|---|---|---|
| Tricon Sfr 2024-3 Borrower Llc | -- | Os National | |
| Tricon American Homes Llc | -- | Os National | |
| Tah 2017-1 Equity Owner Llc | -- | Os National | |
| Tricon American Homes Llc | -- | Os National | |
| Tah 2017-1 Equity Owner Llc | -- | Os National | |
| Sby 2014 1 Broower Llc | -- | None Available | |
| Sby 2014 1 Equity Owner Llc | -- | None Available | |
| Silver Bay Operating Partnership Lp | -- | None Available | |
| Sb Financing Trust Owner Llc | -- | None Available | |
| Sb Financial Trust | -- | None Available | |
| 2012 B Property Holdings Llc | $1,000,000 | National Title Company | |
| Schultz Christopher J | $280,000 | Nevada Title Company | |
| Cogeshall Sherry L | -- | -- |
Source: Public Records
Mortgage History
| Date | Status | Borrower | Loan Amount |
|---|---|---|---|
| Previous Owner | Schultz Christopher J | $273,580 |
Source: Public Records
Tax History Compared to Growth
Tax History
| Year | Tax Paid | Tax Assessment Tax Assessment Total Assessment is a certain percentage of the fair market value that is determined by local assessors to be the total taxable value of land and additions on the property. | Land | Improvement |
|---|---|---|---|---|
| 2025 | $1,496 | $69,585 | $28,000 | $41,585 |
| 2024 | $1,386 | $69,585 | $28,000 | $41,585 |
| 2023 | $1,386 | $74,566 | $34,300 | $40,266 |
| 2022 | $1,284 | $64,464 | $27,300 | $37,164 |
| 2021 | $1,189 | $59,430 | $23,800 | $35,630 |
| 2020 | $1,101 | $58,789 | $23,100 | $35,689 |
| 2019 | $1,032 | $56,380 | $21,000 | $35,380 |
| 2018 | $985 | $52,508 | $18,200 | $34,308 |
| 2017 | $1,482 | $51,111 | $16,100 | $35,011 |
| 2016 | $923 | $45,356 | $9,800 | $35,556 |
| 2015 | $920 | $40,219 | $9,800 | $30,419 |
| 2014 | $891 | $31,892 | $7,350 | $24,542 |
Source: Public Records
Map
Nearby Homes
- 845 Mainsail Ct
- 729 Scottsdale St
- 727 Strawberry Place
- 849 Brahma Ln
- 850 Grape Vine Ave
- 707 Sugarcane Ct
- 923 Saddle Horn Dr
- 812 Bitterroot St
- 810 Singing Drum Dr
- 814 Singing Drum Dr
- 940 Rifle Dr
- Plan 2124 at Caspian Bay - Landings
- Plan 2069 Modeled at Caspian Bay - Landings
- Plan 1850 Modeled at Caspian Bay - Landings
- Plan 1572 at Caspian Bay - Landings
- Plan 2469 Modeled at Caspian Bay - Landings
- 948 San Carlos Creek Ln
- 904 Swift Bear St
- 720 Breezy Ridge Dr
- Plan 2242 at Caspian Bay - Reserves
- 822 Shoreview Dr
- 824 Shoreview Dr
- 820 Shoreview Dr
- 890 Scarlet Ave
- 892 Scarlet Ave
- 888 Scarlet Ave
- 826 Shoreview Dr
- 822 Cherry Dr
- 839 Mainsail Ct
- 886 Scarlet Ave
- 828 Shoreview Dr Unit 18
- 824 Cherry Dr
- 819 Cherry Dr
- 841 Mainsail Ct
- 817 Cherry Dr
- 821 Cherry Dr
- 884 Scarlet Ave Unit 17
- 815 Cherry Dr
- 830 Shoreview Dr
- 741 Brick Dr