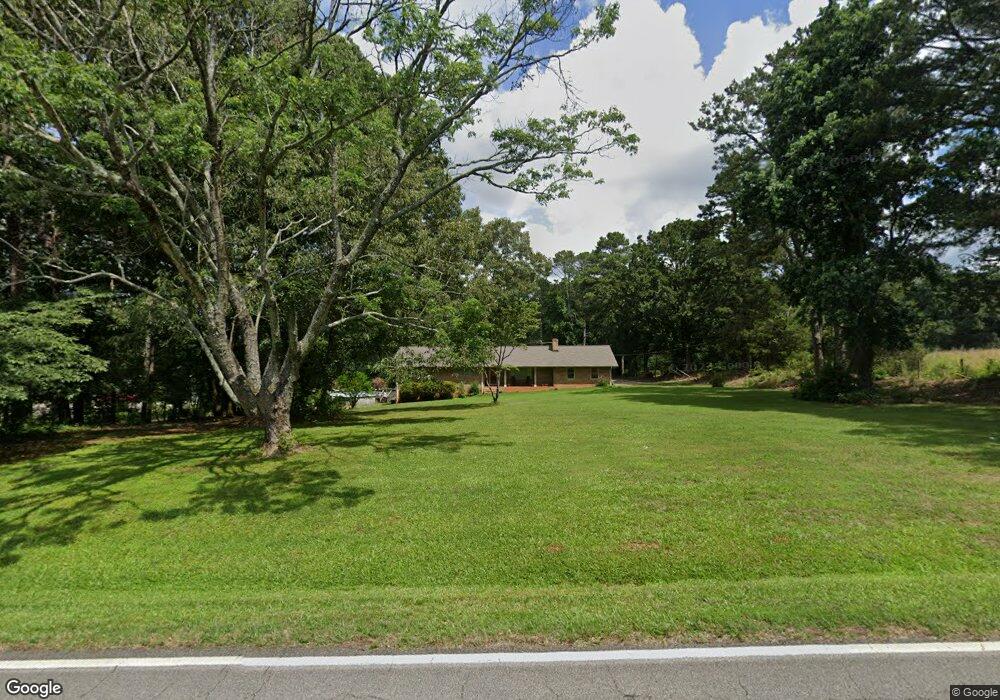
822 Smith Mill Rd Winder, GA 30680
Estimated Value: $310,067 - $378,000
3
Beds
2
Baths
1,782
Sq Ft
$193/Sq Ft
Est. Value
About This Home
This home is located at 822 Smith Mill Rd, Winder, GA 30680 and is currently estimated at $344,767, approximately $193 per square foot. 822 Smith Mill Rd is a home located in Barrow County with nearby schools including Bethlehem Elementary School, Haymon-Morris Middle School, and Apalachee High School.
Ownership History
Date
Name
Owned For
Owner Type
Purchase Details
Closed on
Jan 5, 2021
Sold by
Akins Bradley Scott
Bought by
Hunt Larry L and Hunt Gail
Current Estimated Value
Home Financials for this Owner
Home Financials are based on the most recent Mortgage that was taken out on this home.
Original Mortgage
$105,000
Outstanding Balance
$93,067
Interest Rate
2.71%
Mortgage Type
New Conventional
Estimated Equity
$251,700
Purchase Details
Closed on
Nov 27, 2017
Sold by
Akins Julie Ann Harnisch
Bought by
Akins Bradley Scott
Purchase Details
Closed on
Dec 27, 2012
Sold by
Akins Julie Ann And
Bought by
Harnisch Akins Julie Ann
Purchase Details
Closed on
Aug 25, 2010
Sold by
Akins Brad
Bought by
Harnisch Akins Julie Ann
Purchase Details
Closed on
Jul 5, 2007
Sold by
Casper Delmer
Bought by
Akins Brad
Home Financials for this Owner
Home Financials are based on the most recent Mortgage that was taken out on this home.
Original Mortgage
$177,827
Interest Rate
6.35%
Mortgage Type
New Conventional
Create a Home Valuation Report for This Property
The Home Valuation Report is an in-depth analysis detailing your home's value as well as a comparison with similar homes in the area
Home Values in the Area
Average Home Value in this Area
Purchase History
| Date | Buyer | Sale Price | Title Company |
|---|---|---|---|
| Hunt Larry L | $175,000 | -- | |
| Akins Bradley Scott | -- | -- | |
| Harnisch Akins Julie Ann | -- | -- | |
| Harnisch Akins Julie Ann | -- | -- | |
| Akins Brad | $175,000 | -- |
Source: Public Records
Mortgage History
| Date | Status | Borrower | Loan Amount |
|---|---|---|---|
| Open | Hunt Larry L | $105,000 | |
| Previous Owner | Akins Brad | $177,827 |
Source: Public Records
Tax History
| Year | Tax Paid | Tax Assessment Tax Assessment Total Assessment is a certain percentage of the fair market value that is determined by local assessors to be the total taxable value of land and additions on the property. | Land | Improvement |
|---|---|---|---|---|
| 2025 | $724 | $89,222 | $15,000 | $74,222 |
| 2024 | $769 | $85,608 | $13,500 | $72,108 |
| 2023 | $552 | $85,608 | $13,500 | $72,108 |
| 2022 | $1,916 | $72,317 | $18,000 | $54,317 |
| 2021 | $1,830 | $60,253 | $14,000 | $46,253 |
| 2020 | $1,743 | $57,172 | $15,124 | $42,048 |
| 2019 | $1,775 | $57,172 | $15,124 | $42,048 |
| 2018 | $1,753 | $57,172 | $15,124 | $42,048 |
| 2017 | $1,489 | $51,124 | $15,124 | $36,000 |
| 2016 | $1,559 | $51,124 | $15,124 | $36,000 |
| 2015 | $1,567 | $51,124 | $15,124 | $36,000 |
| 2014 | $1,379 | $43,411 | $7,411 | $36,000 |
| 2013 | -- | $40,890 | $7,410 | $33,480 |
Source: Public Records
Map
Nearby Homes
- 868 Smith Mill Rd
- 986 Austin Rd
- 890 Smith Mill Rd
- 938 Austin Rd
- 1211 Hog Mountain Rd
- 1210 Austin Rd
- 264 Westminster Ct
- 258 Westminster Ct
- 101 Westminster Ct
- 0 Austin Rd Unit 7698325
- 0 Austin Rd Unit 10665063
- LOT 3 Manning Gin Rd
- LOT 1 Manning Gin Rd
- LOT 2 Manning Gin Rd
- LOT 4 Manning Gin Rd
- LOT 5 Manning Gin Rd
- 0 Perkins Rd Unit 10623675
- 0 Perkins Rd Unit 7664605
- 1 Us 53 Hwy
- 1101 Kailie Dr
- 104 Casper Ct
- 812 Smith Mill Rd
- 102 Casper Ct
- 836 Smith Mill Rd
- 850 Smith Mill Rd
- 106 Casper Ct
- 100 Casper Ct
- 1384 Biedermeier Rd
- 1382 Biedermeier Rd
- 105 Casper Ct
- 1386 Biedermeier Rd
- 103 Casper Ct
- 101 Casper Ct
- 1201 Casper Ln
- 1380 Biedermeier Rd
- 1388 Biedermeier Rd
- 1203 Casper Ln
- 874 Smith Mill Rd
- 874 Smith Mill Rd Unit 10
- 868 Smith Mill Rd Unit 9
Your Personal Tour Guide
Ask me questions while you tour the home.