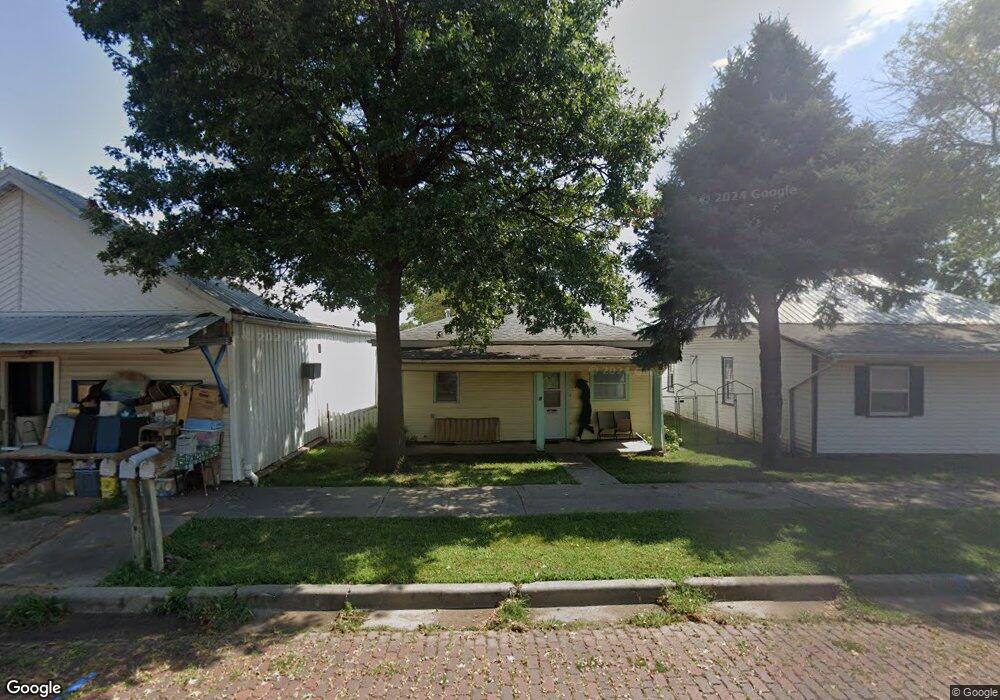
822 Stone St Falls City, NE 68355
Estimated Value: $56,000 - $77,000
2
Beds
1
Bath
792
Sq Ft
$83/Sq Ft
Est. Value
About This Home
This home is located at 822 Stone St, Falls City, NE 68355 and is currently estimated at $65,487, approximately $82 per square foot. 822 Stone St is a home located in Richardson County with nearby schools including Falls City North Elementary School, Falls City South Elementary School, and Falls City Middle School.
Ownership History
Date
Name
Owned For
Owner Type
Purchase Details
Closed on
Jan 8, 2008
Sold by
Pounds Michele I
Bought by
Pounds Life Est Harry Dee
Current Estimated Value
Purchase Details
Closed on
Aug 17, 2006
Sold by
Pounds Harry D
Bought by
Pounds Life Est Harry Dee
Purchase Details
Closed on
Aug 16, 2006
Sold by
Pounds Harry and Pounds Donald Lee
Bought by
Pounds Harry D
Purchase Details
Closed on
Jul 6, 2004
Sold by
Pounds Harry D
Bought by
Pounds Harry D
Create a Home Valuation Report for This Property
The Home Valuation Report is an in-depth analysis detailing your home's value as well as a comparison with similar homes in the area
Home Values in the Area
Average Home Value in this Area
Purchase History
| Date | Buyer | Sale Price | Title Company |
|---|---|---|---|
| Pounds Life Est Harry Dee | -- | -- | |
| Pounds Larry D | -- | -- | |
| Pounds Life Est Harry Dee | -- | -- | |
| Pounds Harry D | -- | -- | |
| Pounds Harry D | -- | -- |
Source: Public Records
Tax History Compared to Growth
Tax History
| Year | Tax Paid | Tax Assessment Tax Assessment Total Assessment is a certain percentage of the fair market value that is determined by local assessors to be the total taxable value of land and additions on the property. | Land | Improvement |
|---|---|---|---|---|
| 2025 | $158 | $42,228 | $3,750 | $38,478 |
| 2024 | $158 | $40,050 | $3,750 | $36,300 |
| 2023 | $0 | $17,643 | $3,750 | $13,893 |
| 2022 | $0 | $15,835 | $2,430 | $13,405 |
| 2021 | $0 | $14,203 | $2,430 | $11,773 |
| 2020 | $0 | $13,642 | $2,430 | $11,212 |
| 2019 | $0 | $13,315 | $2,430 | $10,885 |
| 2018 | $0 | $12,998 | $2,430 | $10,568 |
| 2017 | $253 | $12,998 | $2,430 | $10,568 |
| 2016 | -- | $12,690 | $2,430 | $10,260 |
| 2015 | $247 | $12,690 | $2,430 | $10,260 |
| 2014 | $246 | $12,690 | $2,430 | $10,260 |
Source: Public Records
Map
Nearby Homes