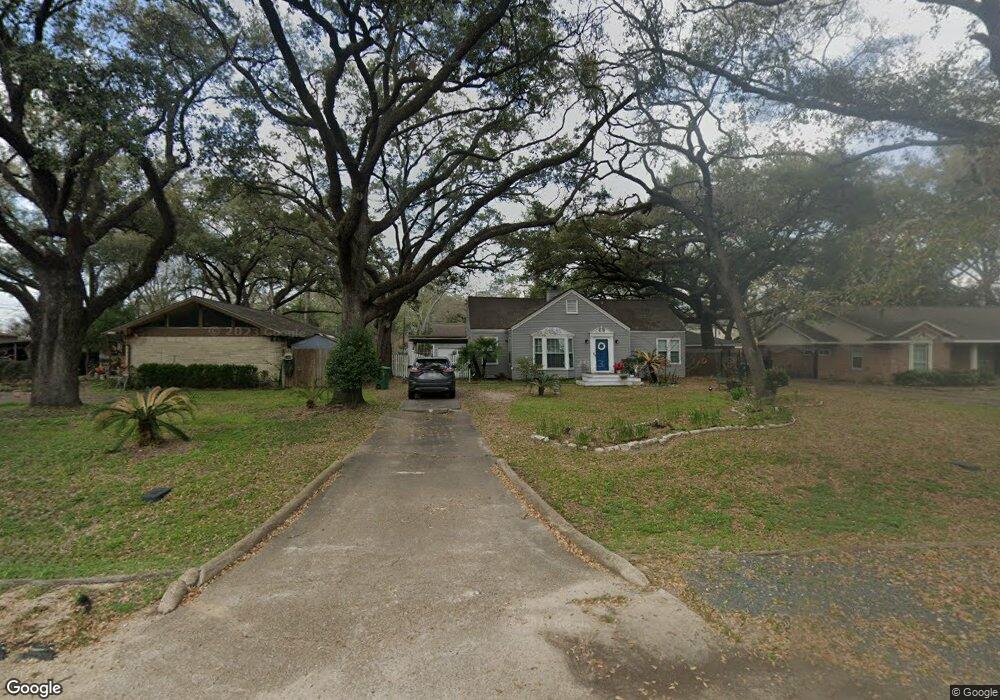
822 W 30th St Houston, TX 77018
Oak Forest-Garden Oaks NeighborhoodEstimated Value: $508,000 - $656,000
2
Beds
2
Baths
1,644
Sq Ft
$362/Sq Ft
Est. Value
About This Home
This home is located at 822 W 30th St, Houston, TX 77018 and is currently estimated at $594,809, approximately $361 per square foot. 822 W 30th St is a home located in Harris County with nearby schools including Garden Oaks Montessori, Frank Black Middle School, and Waltrip High School.
Ownership History
Date
Name
Owned For
Owner Type
Purchase Details
Closed on
Nov 21, 2005
Sold by
Smallwood Guy W
Bought by
Smallwood Susan Kay
Current Estimated Value
Home Financials for this Owner
Home Financials are based on the most recent Mortgage that was taken out on this home.
Original Mortgage
$86,500
Outstanding Balance
$47,626
Interest Rate
6.12%
Estimated Equity
$547,183
Purchase Details
Closed on
Nov 27, 2000
Sold by
Skyler Nelson and Skyler Denise
Bought by
Smallwood Guy W and Smallwood Susan K
Home Financials for this Owner
Home Financials are based on the most recent Mortgage that was taken out on this home.
Original Mortgage
$92,500
Interest Rate
7.82%
Purchase Details
Closed on
May 23, 1996
Sold by
Green Terry L and Green Sharon A
Bought by
Skyler Nelson
Home Financials for this Owner
Home Financials are based on the most recent Mortgage that was taken out on this home.
Original Mortgage
$100,818
Interest Rate
8.06%
Mortgage Type
FHA
Create a Home Valuation Report for This Property
The Home Valuation Report is an in-depth analysis detailing your home's value as well as a comparison with similar homes in the area
Home Values in the Area
Average Home Value in this Area
Purchase History
| Date | Buyer | Sale Price | Title Company |
|---|---|---|---|
| Smallwood Susan Kay | -- | -- | |
| Smallwood Guy W | -- | Charter Title Company | |
| Skyler Nelson | -- | First American Title |
Source: Public Records
Mortgage History
| Date | Status | Borrower | Loan Amount |
|---|---|---|---|
| Open | Smallwood Susan Kay | $86,500 | |
| Closed | Smallwood Guy W | $92,500 | |
| Previous Owner | Skyler Nelson | $100,818 |
Source: Public Records
Tax History Compared to Growth
Tax History
| Year | Tax Paid | Tax Assessment Tax Assessment Total Assessment is a certain percentage of the fair market value that is determined by local assessors to be the total taxable value of land and additions on the property. | Land | Improvement |
|---|---|---|---|---|
| 2025 | $7,800 | $603,013 | $571,725 | $31,288 |
| 2024 | $7,800 | $516,985 | $476,438 | $40,547 |
| 2023 | $7,800 | $512,022 | $476,438 | $35,584 |
| 2022 | $11,723 | $532,412 | $449,213 | $83,199 |
| 2021 | $11,651 | $499,900 | $421,988 | $77,912 |
| 2020 | $12,570 | $538,528 | $421,988 | $116,540 |
| 2019 | $11,941 | $538,528 | $421,988 | $116,540 |
| 2018 | $8,426 | $429,000 | $285,863 | $143,137 |
| 2017 | $11,126 | $440,000 | $285,863 | $154,137 |
| 2016 | $11,076 | $444,729 | $285,863 | $158,866 |
| 2015 | $7,304 | $408,167 | $285,863 | $122,304 |
| 2014 | $7,304 | $362,000 | $231,413 | $130,587 |
Source: Public Records
Map
Nearby Homes
- 822 W 31st St
- 3203 Garden Oaks View
- 804 W 27th St
- 2653 Fountain Key Blvd
- 840 W 26th St
- 2708 N Shepherd Dr
- 2524 Brinkman St Unit B
- 837 W 25th St
- 1041 Gardendale Dr
- 811 Sara Rose St
- 717 Sue Barnett Dr
- 520 W 30th St
- 1115 Gardendale Dr
- 904 W 25th St Unit D
- 1114 Beall Landing Ct
- 1121 Beall Landing Ct
- 519 W 31st St
- 544 W 28th St
- 1119 W 30th St
- 933 W 24th St Unit A
- 826 W 30th St
- 818 W 30th St
- 814 W 30th St
- 821 W 31st St
- 3006 Attridge Rd
- 3010 Attridge Rd
- 825 W 31st St
- 817 W 31st St
- 3002 Attridge Rd
- 810 W 30th St
- 3014 Attridge Rd
- 3018 Attridge Rd
- 813 W 31st St
- 821 W 30th St
- 817 W 30th St
- 825 W 30th St
- 3022 Attridge Rd
- 2926 Attridge Rd
- 806 W 30th St
- 813 W 30th St