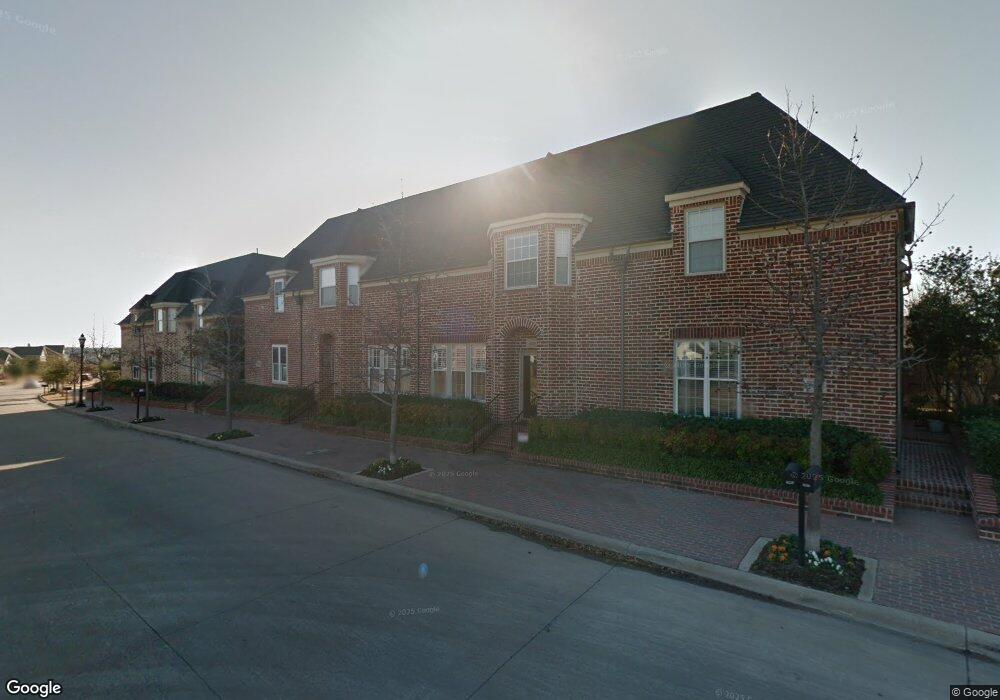
8220 Bridge St North Richland Hills, TX 76180
Estimated Value: $362,976 - $371,000
3
Beds
3
Baths
1,730
Sq Ft
$213/Sq Ft
Est. Value
About This Home
This home is located at 8220 Bridge St, North Richland Hills, TX 76180 and is currently estimated at $367,994, approximately $212 per square foot. 8220 Bridge St is a home located in Tarrant County with nearby schools including Walker Creek Elementary School, Smithfield Middle School, and Birdville High School.
Ownership History
Date
Name
Owned For
Owner Type
Purchase Details
Closed on
Oct 20, 2017
Sold by
Gardener Britton Clint and Gardener Charity
Bought by
Strayer Patrick and Strayer Amanda
Current Estimated Value
Home Financials for this Owner
Home Financials are based on the most recent Mortgage that was taken out on this home.
Original Mortgage
$227,905
Outstanding Balance
$123,677
Interest Rate
3.78%
Mortgage Type
New Conventional
Estimated Equity
$244,317
Purchase Details
Closed on
Aug 9, 2017
Sold by
Gardner Mary M
Bought by
Gardner Britton Clint
Purchase Details
Closed on
Nov 8, 2002
Sold by
Cambridge Homes Inc
Bought by
Gardner Mary M
Home Financials for this Owner
Home Financials are based on the most recent Mortgage that was taken out on this home.
Original Mortgage
$124,750
Interest Rate
5.95%
Create a Home Valuation Report for This Property
The Home Valuation Report is an in-depth analysis detailing your home's value as well as a comparison with similar homes in the area
Home Values in the Area
Average Home Value in this Area
Purchase History
| Date | Buyer | Sale Price | Title Company |
|---|---|---|---|
| Strayer Patrick | -- | None Available | |
| Gardner Britton Clint | -- | None Available | |
| Gardner Mary M | -- | Commonwealth Land Title |
Source: Public Records
Mortgage History
| Date | Status | Borrower | Loan Amount |
|---|---|---|---|
| Open | Strayer Patrick | $227,905 | |
| Previous Owner | Gardner Mary M | $124,750 | |
| Closed | Gardner Mary M | $23,400 |
Source: Public Records
Tax History Compared to Growth
Tax History
| Year | Tax Paid | Tax Assessment Tax Assessment Total Assessment is a certain percentage of the fair market value that is determined by local assessors to be the total taxable value of land and additions on the property. | Land | Improvement |
|---|---|---|---|---|
| 2025 | $5,186 | $319,824 | $35,000 | $284,824 |
| 2024 | $5,186 | $319,824 | $35,000 | $284,824 |
| 2023 | $7,047 | $321,232 | $35,000 | $286,232 |
| 2022 | $7,390 | $310,639 | $37,500 | $273,139 |
| 2021 | $7,104 | $279,198 | $37,500 | $241,698 |
| 2020 | $7,219 | $286,482 | $37,500 | $248,982 |
| 2019 | $6,792 | $270,195 | $20,000 | $250,195 |
| 2018 | $5,605 | $234,463 | $20,000 | $214,463 |
| 2017 | $6,103 | $226,842 | $20,000 | $206,842 |
| 2016 | $6,141 | $228,255 | $20,000 | $208,255 |
| 2015 | $3,639 | $179,100 | $20,000 | $159,100 |
| 2014 | $3,639 | $179,100 | $20,000 | $159,100 |
Source: Public Records
Map
Nearby Homes
- 8240 Bridge St
- 6017 Avalon St
- 6113 Cliffbrook Dr
- 8321 Bridge St
- 6250 Shirley Dr
- 8020 Bridge St
- 7800 Mockingbird Ln Unit 29
- 7800 Mockingbird Ln Unit 81
- 7800 Mockingbird Ln Unit 73
- 7800 Mockingbird Ln Unit 43
- 7800 Mockingbird Ln Unit 205
- 8057 Caladium Dr
- 5920 Pedernales Ridge
- 6116 Morningside Dr
- 6137 Marquita Mews
- 0 Mid Cities Blvd
- 8740 Ice House Dr
- 6008 Monterey Mews
- 8748 Morris Mews
- 7713 Deaver Dr
- 8224 Bridge St
- 8228 Bridge St
- 8212 Bridge St
- 8208 Bridge St
- 8232 Bridge St
- 8236 Bridge St
- 8204 Bridge St
- 8205 Euclid Ave
- 8200 Bridge St
- 8221 Bridge St
- 6021 Roaring Springs Dr
- 8201 Euclid Ave
- 8213 Euclid Ave
- 8217 Bridge St
- 8244 Bridge St
- 6025 Roaring Springs Dr
- 8213 Bridge St
- 6029 Roaring Springs Dr
- 6021 Avalon St
- 8248 Bridge St