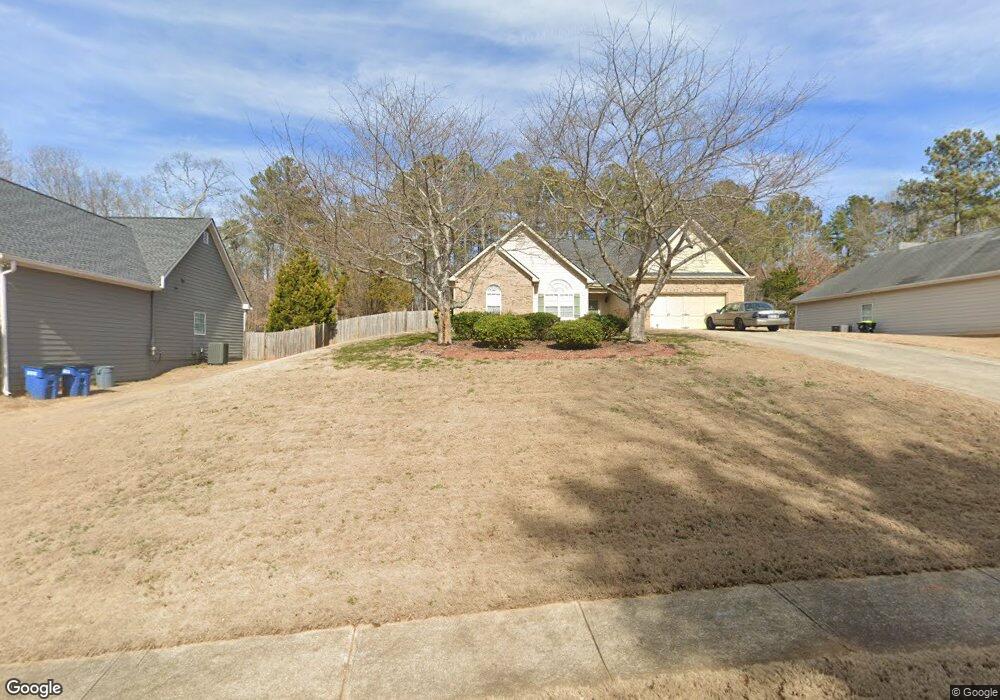
8220 Mossybrook Ln Unit 1 Douglasville, GA 30135
Estimated Value: $334,878 - $409,000
3
Beds
2
Baths
2,197
Sq Ft
$165/Sq Ft
Est. Value
About This Home
This home is located at 8220 Mossybrook Ln Unit 1, Douglasville, GA 30135 and is currently estimated at $361,470, approximately $164 per square foot. 8220 Mossybrook Ln Unit 1 is a home located in Douglas County with nearby schools including South Douglas Elementary School, Fairplay Middle School, and Alexander High School.
Ownership History
Date
Name
Owned For
Owner Type
Purchase Details
Closed on
Jul 16, 2020
Sold by
Wright Cedric Derell
Bought by
Wright Cedric Derell and Wright Yvonne Slyvia
Current Estimated Value
Home Financials for this Owner
Home Financials are based on the most recent Mortgage that was taken out on this home.
Original Mortgage
$225,834
Outstanding Balance
$200,255
Interest Rate
3.1%
Mortgage Type
FHA
Estimated Equity
$161,215
Purchase Details
Closed on
Sep 14, 2005
Sold by
White Betty L
Bought by
White Betty L and Spencer Marlene
Purchase Details
Closed on
May 7, 2004
Sold by
R M Lackey Homes Inc
Bought by
White Betty L
Home Financials for this Owner
Home Financials are based on the most recent Mortgage that was taken out on this home.
Original Mortgage
$150,320
Interest Rate
5.88%
Mortgage Type
New Conventional
Create a Home Valuation Report for This Property
The Home Valuation Report is an in-depth analysis detailing your home's value as well as a comparison with similar homes in the area
Home Values in the Area
Average Home Value in this Area
Purchase History
| Date | Buyer | Sale Price | Title Company |
|---|---|---|---|
| Wright Cedric Derell | -- | -- | |
| Wright Cederic Derell | $230,000 | -- | |
| White Betty L | -- | -- | |
| White Betty L | $187,900 | -- |
Source: Public Records
Mortgage History
| Date | Status | Borrower | Loan Amount |
|---|---|---|---|
| Open | Wright Cederic Derell | $225,834 | |
| Closed | Wright Cedric Derell | $225,834 | |
| Previous Owner | White Betty L | $150,320 |
Source: Public Records
Tax History Compared to Growth
Tax History
| Year | Tax Paid | Tax Assessment Tax Assessment Total Assessment is a certain percentage of the fair market value that is determined by local assessors to be the total taxable value of land and additions on the property. | Land | Improvement |
|---|---|---|---|---|
| 2024 | $3,490 | $128,840 | $26,400 | $102,440 |
| 2023 | $3,490 | $150,200 | $27,520 | $122,680 |
| 2022 | $3,200 | $108,560 | $16,000 | $92,560 |
| 2021 | $2,750 | $85,840 | $13,800 | $72,040 |
| 2020 | $2,903 | $85,840 | $13,800 | $72,040 |
| 2019 | $2,653 | $83,880 | $13,800 | $70,080 |
| 2018 | $2,575 | $80,960 | $13,800 | $67,160 |
| 2017 | $2,517 | $77,600 | $14,680 | $62,920 |
| 2016 | $2,582 | $78,280 | $15,240 | $63,040 |
| 2015 | $2,223 | $69,720 | $13,960 | $55,760 |
| 2014 | $2,223 | $64,480 | $13,960 | $50,520 |
| 2013 | -- | $60,160 | $13,080 | $47,080 |
Source: Public Records
Map
Nearby Homes
- 6086 Willowpond Ct
- 5995 Azalea Ridge Dr
- 8390 Mossybrook Ln
- 6035 Post Rd
- 6554 Fox Run
- 8951 Callaway Dr
- 6340 Lakeview Terrace
- 5475 Trout Creek Dr
- 7900 Sweetwater Dr
- 7935 Sweetwater Dr
- 5419 Tyree Rd
- 7900 Downs Rd
- 5270 Pinnacle Pointe
- 7493 Elderberry Dr
- 8228 River Pointe Overlook
- 5845 Pecan Grove Place
- 5522 Tyree Rd
- 5512 Tyree Rd
- 8220 Mossybrook Ln
- 8210 Mossybrook Ln Unit 1
- 8230 Mossybrook Ln Unit 74
- 8230 Mossybrook Ln
- 8200 Mossybrook Ln Unit 1
- 8240 Mossybrook Ln
- 5461 Dylan Ct Unit 1
- 8225 Mossybrook Ln
- 8190 Mossybrook Ln Unit 1
- 5471 Dylan Ct Unit 62
- 5471 Dylan Ct Unit 1
- 8289 Banks Mill Rd
- 8250 Mossybrook Ln
- 8265 Mossybrook Ln
- 5462 Dylan Ct
- 5462 Dylan Ct
- 0 Dylan Ct Unit 8566918
- 0 Dylan Ct Unit 7100248
- 5481 Dylan Ct
- 8180 Mossybrook Ln