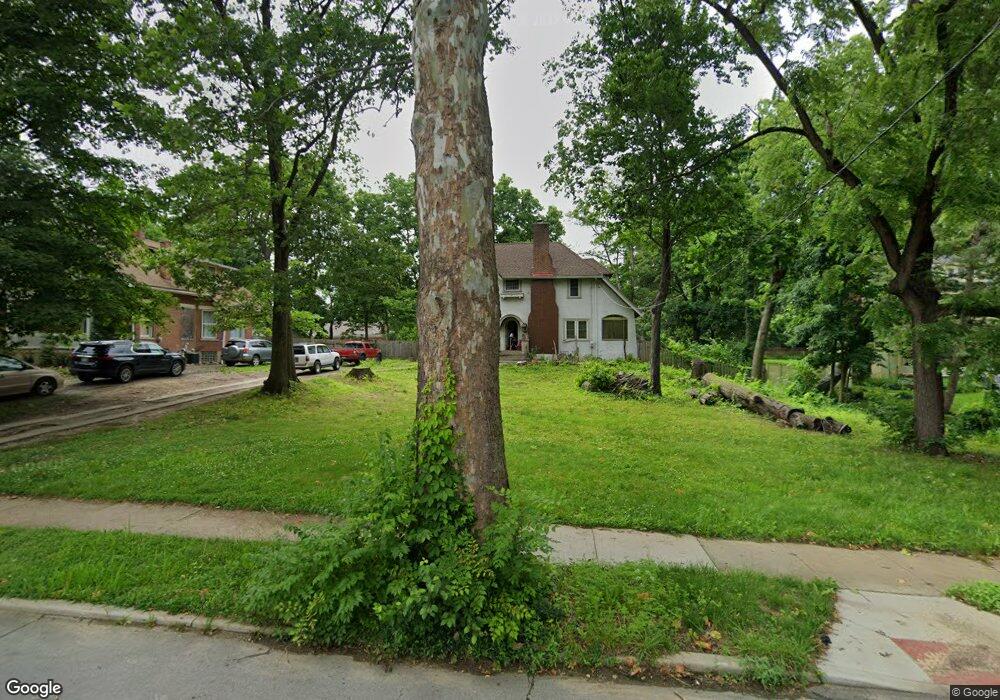
8221 Woodbine Ave Cincinnati, OH 45216
Hartwell NeighborhoodEstimated Value: $195,000 - $241,000
3
Beds
1
Bath
1,800
Sq Ft
$124/Sq Ft
Est. Value
About This Home
This home is located at 8221 Woodbine Ave, Cincinnati, OH 45216 and is currently estimated at $222,430, approximately $123 per square foot. 8221 Woodbine Ave is a home located in Hamilton County with nearby schools including Rising Stars at Carthage, Hartwell School, and Shroder High School.
Ownership History
Date
Name
Owned For
Owner Type
Purchase Details
Closed on
Oct 30, 2020
Sold by
Palmer Gregory L and Palmer Holli C
Bought by
Perez Sury C Morales
Current Estimated Value
Home Financials for this Owner
Home Financials are based on the most recent Mortgage that was taken out on this home.
Original Mortgage
$140,949
Outstanding Balance
$125,425
Interest Rate
2.8%
Mortgage Type
FHA
Estimated Equity
$97,005
Purchase Details
Closed on
Aug 29, 2002
Sold by
Rutherford Tom W and Rutherford Kathleen A
Bought by
Palmer Gregory L and Palmer Holli C
Purchase Details
Closed on
Nov 1, 1993
Sold by
Dawson Judith E
Bought by
Rutherford Tom W and Rutherford Kathleen A
Home Financials for this Owner
Home Financials are based on the most recent Mortgage that was taken out on this home.
Original Mortgage
$60,800
Interest Rate
6.96%
Create a Home Valuation Report for This Property
The Home Valuation Report is an in-depth analysis detailing your home's value as well as a comparison with similar homes in the area
Home Values in the Area
Average Home Value in this Area
Purchase History
| Date | Buyer | Sale Price | Title Company |
|---|---|---|---|
| Perez Sury C Morales | $143,550 | Rivertowne Title Llc | |
| Palmer Gregory L | $113,000 | -- | |
| Rutherford Tom W | -- | -- |
Source: Public Records
Mortgage History
| Date | Status | Borrower | Loan Amount |
|---|---|---|---|
| Open | Perez Sury C Morales | $140,949 | |
| Previous Owner | Rutherford Tom W | $60,800 |
Source: Public Records
Tax History Compared to Growth
Tax History
| Year | Tax Paid | Tax Assessment Tax Assessment Total Assessment is a certain percentage of the fair market value that is determined by local assessors to be the total taxable value of land and additions on the property. | Land | Improvement |
|---|---|---|---|---|
| 2024 | $3,032 | $50,243 | $12,264 | $37,979 |
| 2023 | $3,097 | $50,243 | $12,264 | $37,979 |
| 2022 | $2,151 | $31,157 | $11,529 | $19,628 |
| 2021 | $2,065 | $31,157 | $11,529 | $19,628 |
| 2020 | $2,122 | $31,157 | $11,529 | $19,628 |
| 2019 | $2,149 | $28,851 | $10,675 | $18,176 |
| 2018 | $2,152 | $28,851 | $10,675 | $18,176 |
| 2017 | $2,045 | $28,851 | $10,675 | $18,176 |
| 2016 | $2,500 | $34,857 | $10,675 | $24,182 |
| 2015 | $2,254 | $34,857 | $10,675 | $24,182 |
| 2014 | $2,270 | $34,857 | $10,675 | $24,182 |
| 2013 | $2,430 | $36,691 | $11,235 | $25,456 |
Source: Public Records
Map
Nearby Homes
- 223 Kearney St
- 29 Hartwell Ct
- 59 Ferndale Ave
- 17 Laurel St
- 36 Laurel St
- 8421 Wiswell St
- 54 Hereford St
- 8410 Curzon Ave
- 81 Hillsdale Ave
- 7866 Greenland Place
- 7901 Glenorchard Dr
- 7871 Glenorchard Dr
- 1604 Crest Hill Ave
- 8442 Anthony Wayne Ave
- 162 Ridgeway Rd
- 7755 Newbedford Ave
- 505 Olden Ave
- 504 Olden Ave
- 1614 Miramar Ct
- 38 Escalon St
- 8215 Woodbine Ave
- 8231 Woodbine Ave
- 156 Parkway Ave
- 148 Parkway Ave
- 8230 Woodbine Ave
- 8241 Woodbine Ave
- 8214 Woodbine Ave
- 211 Kearney St
- 8208 Woodbine Ave
- 8206 Woodbine Ave
- 217 Kearney St
- 8238 Woodbine Ave
- 208 Parkway Ave
- 136 Parkway Ave
- 8258 Woodbine Ave
- 219 Kearney St
- 8232 Monon Ave
- 8257 Woodbine Ave
- 8248 Woodbine Ave
- 214 Parkway Ave