Estimated Value: $697,530 - $1,161,000
4
Beds
3
Baths
3,051
Sq Ft
$287/Sq Ft
Est. Value
About This Home
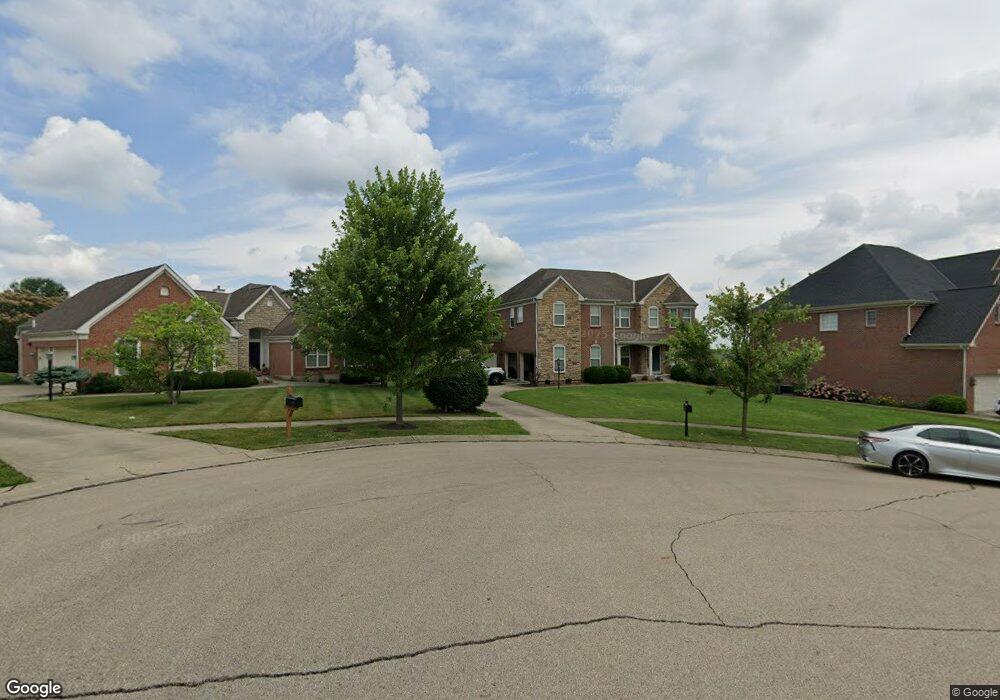
This home is located at 8222 Pineleigh Ct, Mason, OH 45040 and is currently estimated at $874,633, approximately $286 per square foot. 8222 Pineleigh Ct is a home located in Warren County with nearby schools including Mason Intermediate Elementary School, Mason Middle School, and William Mason High School.
Ownership History
Date
Name
Owned For
Owner Type
Purchase Details
Closed on
Aug 2, 2006
Sold by
The Drees Co
Bought by
Wang Xiaohong and Li Ning
Current Estimated Value
Home Financials for this Owner
Home Financials are based on the most recent Mortgage that was taken out on this home.
Original Mortgage
$367,600
Outstanding Balance
$215,040
Interest Rate
6.77%
Mortgage Type
Purchase Money Mortgage
Estimated Equity
$659,593
Purchase Details
Closed on
Mar 15, 2006
Sold by
Rhein Development Llc
Bought by
The Drees Co
Create a Home Valuation Report for This Property
The Home Valuation Report is an in-depth analysis detailing your home's value as well as a comparison with similar homes in the area
Home Values in the Area
Average Home Value in this Area
Purchase History
| Date | Buyer | Sale Price | Title Company |
|---|---|---|---|
| Wang Xiaohong | -- | Classic Title | |
| The Drees Co | $78,100 | None Available |
Source: Public Records
Mortgage History
| Date | Status | Borrower | Loan Amount |
|---|---|---|---|
| Open | Wang Xiaohong | $367,600 |
Source: Public Records
Tax History
| Year | Tax Paid | Tax Assessment Tax Assessment Total Assessment is a certain percentage of the fair market value that is determined by local assessors to be the total taxable value of land and additions on the property. | Land | Improvement |
|---|---|---|---|---|
| 2025 | $8,543 | $198,670 | $45,500 | $153,170 |
| 2024 | $8,543 | $198,670 | $45,500 | $153,170 |
| 2023 | $7,734 | $148,074 | $26,950 | $121,124 |
| 2022 | $7,601 | $148,075 | $26,950 | $121,125 |
| 2021 | $7,233 | $148,075 | $26,950 | $121,125 |
| 2020 | $7,736 | $134,614 | $24,500 | $110,114 |
| 2019 | $7,172 | $134,614 | $24,500 | $110,114 |
| 2018 | $7,108 | $134,614 | $24,500 | $110,114 |
| 2017 | $7,549 | $130,253 | $25,106 | $105,147 |
| 2016 | $7,758 | $130,253 | $25,106 | $105,147 |
| 2015 | $7,172 | $130,253 | $25,106 | $105,147 |
| 2014 | $7,172 | $112,290 | $21,640 | $90,640 |
| 2013 | $7,187 | $127,100 | $24,500 | $102,600 |
Source: Public Records
Map
Nearby Homes
- 5369 N Shore Place
- 5576 Winding Cape Way
- 9018 Boylston St
- 9024 Beacon St
- 6304 Trailwood Ct
- 6285 Greenwood Ct
- 6315 Greenwood Ct
- 4796 White Blossom Blvd
- 9240 Beacon St
- 9246 Beacon St
- 5673 Melbury Ct
- 5641 Melbury Ct
- 8588 Charleston Creek Dr
- 5850 Homecrest Ln
- 5686 Farm Field Dr
- 5449 Old Farm Dr
- 4390 S Mallard Cove
- 5434 Old Farm Dr
- 6713 Quail Lake
- 2113 Clearwater Ct
- 8226 Pineleigh Ct
- 8218 Pineleigh Ct
- 8377 Ashmont Way
- 8214 Pineleigh Ct
- 8373 Ashmont Way
- 8381 Ashmont Way
- 8230 Pineleigh Ct
- 8223 Pineleigh Ct
- 8369 Ashmont Way
- 8219 Pineleigh Ct
- A Socialville-Fosters Rd
- 8227 Pineleigh Ct
- 8365 Ashmont Way
- 8374 Ashmont Way
- 8237 Cherrydale Ct
- 8370 Ashmont Way
- 8361 Ashmont Way
- 8375 Ashmont Way
- 5597 Baywatch Way
- 5597 Baywatch Way
Your Personal Tour Guide
Ask me questions while you tour the home.