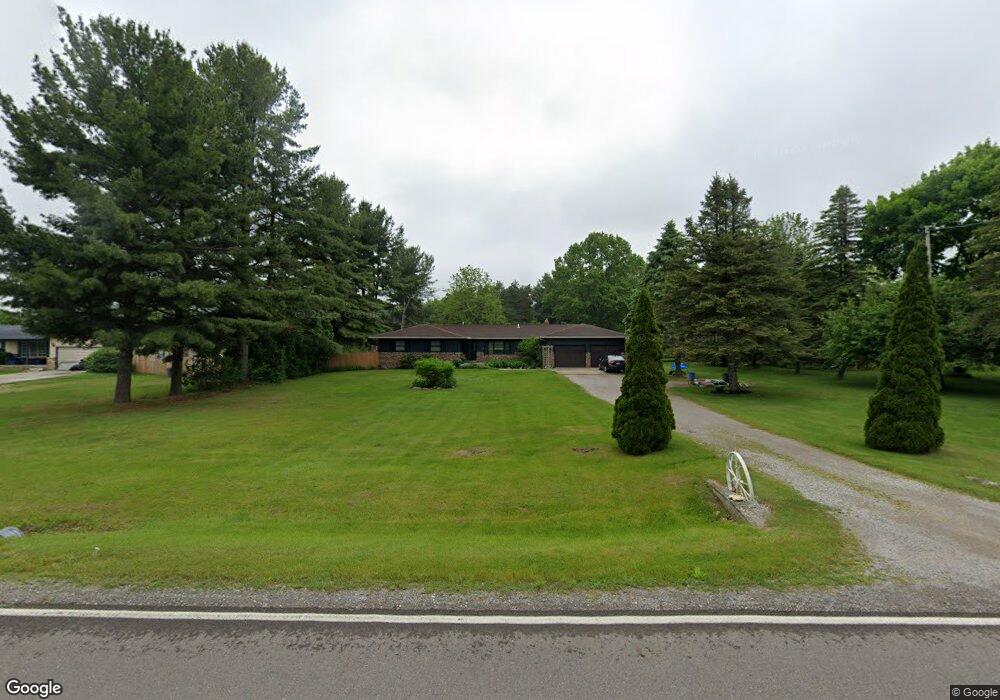
8224 Stanley Rd Flushing, MI 48433
Estimated Value: $241,000 - $336,000
Studio
1
Bath
2,017
Sq Ft
$151/Sq Ft
Est. Value
About This Home
This home is located at 8224 Stanley Rd, Flushing, MI 48433 and is currently estimated at $303,666, approximately $150 per square foot. 8224 Stanley Rd is a home located in Genesee County with nearby schools including Elms Elementary School, Flushing Middle School, and Flushing High School.
Ownership History
Date
Name
Owned For
Owner Type
Purchase Details
Closed on
Mar 25, 2016
Sold by
Rapid Rescue Llc
Bought by
Moon Michael J and Rockman Moon Denee R
Current Estimated Value
Purchase Details
Closed on
Jan 6, 2016
Sold by
Abulibdeh Beverly A
Bought by
Ditech Financial Llc and Green Tree Servicing Llc
Purchase Details
Closed on
Aug 26, 2015
Sold by
Abulibdeh Beverly Ann
Bought by
Rapid Rescue Llc
Purchase Details
Closed on
Jun 18, 2007
Sold by
Abulibdeh Mohammad Saleh
Bought by
Abulibdeh Beverly Ann
Home Financials for this Owner
Home Financials are based on the most recent Mortgage that was taken out on this home.
Original Mortgage
$109,674
Interest Rate
6.37%
Mortgage Type
New Conventional
Create a Home Valuation Report for This Property
The Home Valuation Report is an in-depth analysis detailing your home's value as well as a comparison with similar homes in the area
Home Values in the Area
Average Home Value in this Area
Purchase History
| Date | Buyer | Sale Price | Title Company |
|---|---|---|---|
| Moon Michael J | $200,000 | First American Title Ins Co | |
| Ditech Financial Llc | $104,700 | Attorney | |
| Rapid Rescue Llc | -- | None Available | |
| Abulibdeh Beverly Ann | -- | Cislo Title Co |
Source: Public Records
Mortgage History
| Date | Status | Borrower | Loan Amount |
|---|---|---|---|
| Previous Owner | Abulibdeh Beverly Ann | $109,674 |
Source: Public Records
Tax History
| Year | Tax Paid | Tax Assessment Tax Assessment Total Assessment is a certain percentage of the fair market value that is determined by local assessors to be the total taxable value of land and additions on the property. | Land | Improvement |
|---|---|---|---|---|
| 2025 | $3,365 | $152,800 | $0 | $0 |
| 2024 | $1,828 | $134,000 | $0 | $0 |
| 2023 | $1,745 | $123,100 | $0 | $0 |
| 2022 | $3,038 | $108,100 | $0 | $0 |
| 2021 | $2,976 | $101,500 | $0 | $0 |
| 2020 | $1,623 | $95,800 | $0 | $0 |
| 2019 | $1,606 | $87,000 | $0 | $0 |
| 2018 | $2,787 | $77,600 | $0 | $0 |
| 2017 | $1,294 | $77,600 | $0 | $0 |
| 2016 | $2,330 | $70,000 | $0 | $0 |
| 2015 | $2,039 | $69,000 | $0 | $0 |
| 2014 | $1,191 | $65,600 | $0 | $0 |
| 2012 | -- | $61,800 | $61,800 | $0 |
Source: Public Records
Map
Nearby Homes
- 6355 N Mckinley Rd
- 9031 N Island Dr Unit 29
- 6058 N Mckinley Rd
- 0 N Island Dr Unit 20230029447
- 255 Grissom Ct
- 9207 N Island Ct Unit 12
- 7067 W Stanley Rd
- 271 Lovell Ct
- 7181 W Mount Morris Rd
- 8454 Wesley Dr
- 7267 109th St
- 8520 Apple Blossom Ln
- Vacant Land Rd
- Vacant Land Rd
- Vacant Land Rd
- 5315 Chickasaw Trail
- 8522 Tim Tam Trail
- 621 Ashwood Dr
- 8548 Tim Tam Trail
- 0 Double Tree Estates
- 8224 Stanley Rd
- 8240 Stanley Rd
- 8240 Stanley Rd
- 8204 Stanley Rd
- 8190 Stanley Rd
- 8252 Stanley Rd
- 8270 Stanley Rd
- 8154 Stanley Rd
- 8203 Stanley Rd
- 8290 Stanley Rd
- 8140 Stanley Rd
- 8275 Stanley Rd
- 6495 Deland Rd
- 8122 Stanley Rd
- 8310 W Stanley Rd
- 8310 Stanley Rd
- 6485 Deland Rd
- 6475 Deland Rd
- 8164 Stanley Rd
- 8114 Stanley Rd
Your Personal Tour Guide
Ask me questions while you tour the home.