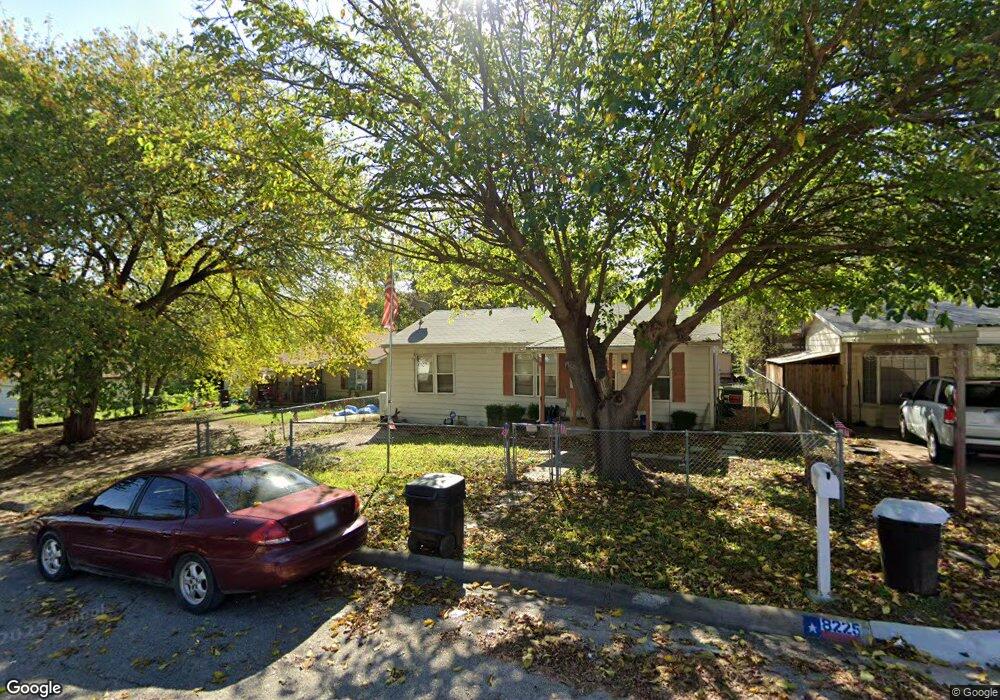
8225 Carlos St Fort Worth, TX 76108
Estimated Value: $185,000 - $197,000
3
Beds
1
Bath
950
Sq Ft
$198/Sq Ft
Est. Value
About This Home
This home is located at 8225 Carlos St, Fort Worth, TX 76108 and is currently estimated at $188,297, approximately $198 per square foot. 8225 Carlos St is a home located in Tarrant County with nearby schools including Liberty Elementary School, Brewer Middle School, and Tannahill Intermediate School.
Ownership History
Date
Name
Owned For
Owner Type
Purchase Details
Closed on
Aug 25, 2025
Sold by
Patterson Raymond
Bought by
Andy P Investments Llc
Current Estimated Value
Home Financials for this Owner
Home Financials are based on the most recent Mortgage that was taken out on this home.
Original Mortgage
$128,000
Outstanding Balance
$128,000
Interest Rate
6.72%
Mortgage Type
Construction
Estimated Equity
$60,297
Purchase Details
Closed on
Jun 19, 2006
Sold by
Bynum Jimmy
Bought by
Patterson Raymond
Purchase Details
Closed on
Jun 15, 1999
Sold by
Qualls Peggy Jean
Bought by
Bynum Cordia
Create a Home Valuation Report for This Property
The Home Valuation Report is an in-depth analysis detailing your home's value as well as a comparison with similar homes in the area
Home Values in the Area
Average Home Value in this Area
Purchase History
| Date | Buyer | Sale Price | Title Company |
|---|---|---|---|
| Andy P Investments Llc | -- | Providence Title Company | |
| Patterson Raymond | -- | None Available | |
| Bynum Cordia | -- | -- |
Source: Public Records
Mortgage History
| Date | Status | Borrower | Loan Amount |
|---|---|---|---|
| Open | Andy P Investments Llc | $128,000 |
Source: Public Records
Tax History Compared to Growth
Tax History
| Year | Tax Paid | Tax Assessment Tax Assessment Total Assessment is a certain percentage of the fair market value that is determined by local assessors to be the total taxable value of land and additions on the property. | Land | Improvement |
|---|---|---|---|---|
| 2025 | $3,303 | $118,583 | $32,995 | $85,588 |
| 2024 | $3,303 | $139,427 | $32,995 | $106,432 |
| 2023 | $3,399 | $142,971 | $32,995 | $109,976 |
| 2022 | $2,970 | $109,678 | $25,000 | $84,678 |
| 2021 | $2,806 | $102,000 | $25,000 | $77,000 |
| 2020 | $2,641 | $95,300 | $25,000 | $70,300 |
| 2019 | $2,741 | $95,300 | $25,000 | $70,300 |
| 2018 | $2,107 | $73,235 | $12,000 | $61,235 |
| 2017 | $1,979 | $67,715 | $12,000 | $55,715 |
| 2016 | $1,994 | $68,250 | $12,000 | $56,250 |
| 2015 | $1,083 | $37,700 | $10,000 | $27,700 |
| 2014 | $1,083 | $37,700 | $10,000 | $27,700 |
Source: Public Records
Map
Nearby Homes