Estimated Value: $605,000 - $706,000
5
Beds
3
Baths
2,586
Sq Ft
$257/Sq Ft
Est. Value
About This Home
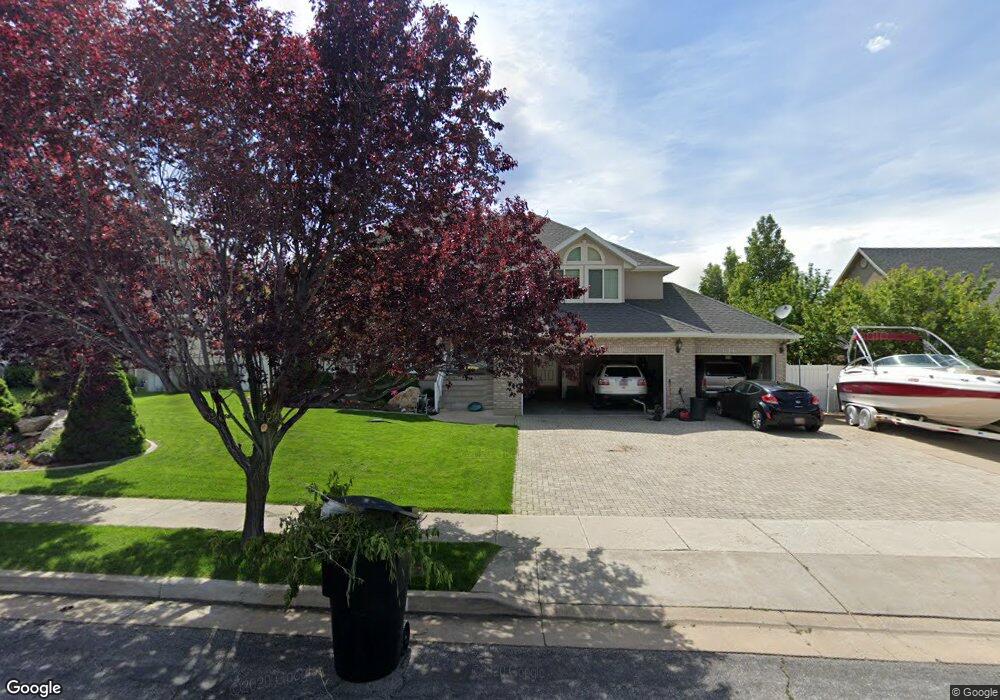
This home is located at 8225 S 2600 E Unit 23, Ogden, UT 84405 and is currently estimated at $665,700, approximately $257 per square foot. 8225 S 2600 E Unit 23 is a home located in Davis County with nearby schools including South Weber Elementary School, Sunset Junior High School, and Northridge High School.
Ownership History
Date
Name
Owned For
Owner Type
Purchase Details
Closed on
May 21, 1998
Sold by
Schmanski Thomas
Bought by
Schmanski Thomas J and Schmanski Lorrie A
Current Estimated Value
Home Financials for this Owner
Home Financials are based on the most recent Mortgage that was taken out on this home.
Original Mortgage
$164,000
Outstanding Balance
$31,961
Interest Rate
7.07%
Estimated Equity
$633,739
Purchase Details
Closed on
Nov 18, 1997
Sold by
Schmanski Lorie
Bought by
Schmanski Thomas
Home Financials for this Owner
Home Financials are based on the most recent Mortgage that was taken out on this home.
Original Mortgage
$167,832
Interest Rate
7.3%
Purchase Details
Closed on
Nov 17, 1997
Sold by
Hidden Oak Inc
Bought by
Schmanski Thomas and Schmanski Lorie
Home Financials for this Owner
Home Financials are based on the most recent Mortgage that was taken out on this home.
Original Mortgage
$167,832
Interest Rate
7.3%
Create a Home Valuation Report for This Property
The Home Valuation Report is an in-depth analysis detailing your home's value as well as a comparison with similar homes in the area
Purchase History
| Date | Buyer | Sale Price | Title Company |
|---|---|---|---|
| Schmanski Thomas J | -- | Inwest Title Services Inc | |
| Schmanski Thomas | -- | Inwest Title Services Inc | |
| Schmanski Thomas | -- | Avis & Archibald Title Insur |
Source: Public Records
Mortgage History
| Date | Status | Borrower | Loan Amount |
|---|---|---|---|
| Open | Schmanski Thomas J | $164,000 | |
| Closed | Schmanski Thomas | $167,832 |
Source: Public Records
Tax History
| Year | Tax Paid | Tax Assessment Tax Assessment Total Assessment is a certain percentage of the fair market value that is determined by local assessors to be the total taxable value of land and additions on the property. | Land | Improvement |
|---|---|---|---|---|
| 2025 | $3,651 | $340,450 | $121,840 | $218,610 |
| 2024 | $3,385 | $322,850 | $98,647 | $224,203 |
| 2023 | $3,381 | $588,000 | $160,098 | $427,902 |
| 2022 | $3,640 | $350,900 | $77,460 | $273,440 |
| 2021 | $3,080 | $451,000 | $116,493 | $334,507 |
| 2020 | $2,776 | $395,000 | $108,818 | $286,182 |
| 2019 | $2,761 | $386,000 | $106,250 | $279,750 |
| 2018 | $2,408 | $353,000 | $98,109 | $254,891 |
| 2016 | $2,308 | $179,630 | $40,029 | $139,601 |
| 2015 | $2,554 | $189,585 | $40,029 | $149,556 |
| 2014 | $2,422 | $183,729 | $46,010 | $137,719 |
| 2013 | -- | $162,862 | $46,842 | $116,020 |
Source: Public Records
Map
Nearby Homes
- 8036 S 2575 E
- 2586 Deer Run Dr
- 2357 E 8100 S
- 2772 E 3575 N
- 7897 S 2700 E Unit 303
- 7897 S 2700 E Unit 305
- 2765 E 7825 S
- 7841 Peachwood Dr
- 3532 N Layton Ridge Dr
- 3297 N Layton Ridge Dr
- 7886 S 2100 E
- 3087 N 2250 E
- 3232 N Redtail Way
- 2353 Canyon View Dr
- 7478 1980 E
- 1827 E Whitetail Dr
- 1809 E Whitetail Dr
- 2569 N 2900 E
- 1821 E Whitetail Way
- 1935 Deere Valley Dr
- 8225 S 2600 E
- 8225 S 2600 E Unit 24
- 8225 S 2600 E Unit 28
- 8225 S 2600 E Unit 25
- 8225 S 2600 E Unit 21
- 8225 S 2600 E Unit 22
- 8225 S 2600 E Unit 20
- 8225 S 2600 E Unit 18
- 8225 S 2600 E Unit 19
- 8225 S 2600 E Unit 17
- 8225 S 2600 E Unit 16
- 8209 S 2600 E
- 8237 S 2600 E
- 8224 S 2560 E
- 8238 S 2560 E
- 8212 S 2560 E
- 8222 S 2600 E
- 8251 S 2600 E
- 8234 S 2600 E
- 8210 S 2600 E
Your Personal Tour Guide
Ask me questions while you tour the home.