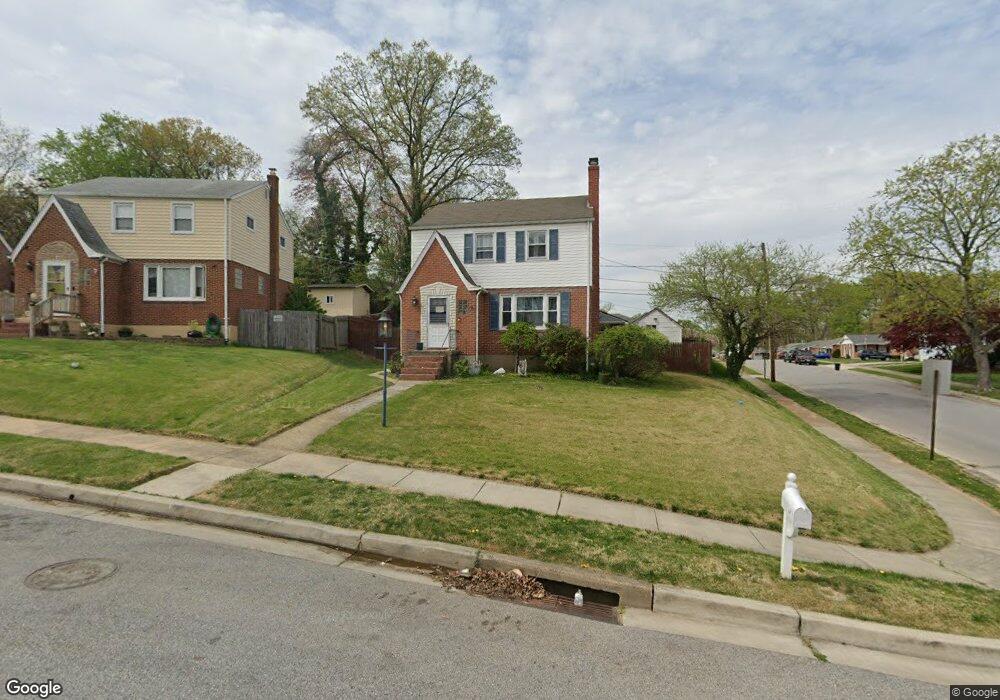
8226 Edwill Ave Rosedale, MD 21237
Estimated Value: $283,000 - $333,000
Studio
2
Baths
1,288
Sq Ft
$246/Sq Ft
Est. Value
About This Home
This home is located at 8226 Edwill Ave, Rosedale, MD 21237 and is currently estimated at $316,294, approximately $245 per square foot. 8226 Edwill Ave is a home located in Baltimore County with nearby schools including Red House Run Elementary School, Golden Ring Middle School, and Overlea High School.
Ownership History
Date
Name
Owned For
Owner Type
Purchase Details
Closed on
Nov 29, 2019
Sold by
Tawney Charles W and Fello Shannon
Bought by
Milligan Kyle
Current Estimated Value
Home Financials for this Owner
Home Financials are based on the most recent Mortgage that was taken out on this home.
Original Mortgage
$250,381
Outstanding Balance
$221,143
Interest Rate
4.12%
Mortgage Type
FHA
Estimated Equity
$95,151
Purchase Details
Closed on
Mar 1, 2005
Sold by
Tawney Charles W
Bought by
Tawney Charles W and Shannon Tawney
Home Financials for this Owner
Home Financials are based on the most recent Mortgage that was taken out on this home.
Original Mortgage
$146,625
Interest Rate
8.37%
Mortgage Type
Adjustable Rate Mortgage/ARM
Purchase Details
Closed on
Feb 29, 2000
Sold by
Biscoe Nancy F
Bought by
Tawney Charles W and Brune Judith
Create a Home Valuation Report for This Property
The Home Valuation Report is an in-depth analysis detailing your home's value as well as a comparison with similar homes in the area
Home Values in the Area
Average Home Value in this Area
Purchase History
| Date | Buyer | Sale Price | Title Company |
|---|---|---|---|
| Milligan Kyle | $255,000 | Guaranteed Trust Title Llc | |
| Tawney Charles W | -- | -- | |
| Tawney Charles W | -- | -- | |
| Tawney Charles W | $119,500 | -- |
Source: Public Records
Mortgage History
| Date | Status | Borrower | Loan Amount |
|---|---|---|---|
| Open | Milligan Kyle | $250,381 | |
| Previous Owner | Tawney Charles W | $146,625 |
Source: Public Records
Tax History
| Year | Tax Paid | Tax Assessment Tax Assessment Total Assessment is a certain percentage of the fair market value that is determined by local assessors to be the total taxable value of land and additions on the property. | Land | Improvement |
|---|---|---|---|---|
| 2025 | $4,163 | $265,067 | -- | -- |
| 2024 | $4,163 | $245,633 | -- | -- |
| 2023 | $1,731 | $226,200 | $78,500 | $147,700 |
| 2022 | $3,094 | $210,333 | $0 | $0 |
| 2021 | $2,870 | $194,467 | $0 | $0 |
| 2020 | $2,165 | $178,600 | $78,500 | $100,100 |
| 2019 | $2,163 | $178,467 | $0 | $0 |
| 2018 | $2,720 | $178,333 | $0 | $0 |
| 2017 | $2,600 | $178,200 | $0 | $0 |
| 2016 | $2,402 | $177,967 | $0 | $0 |
| 2015 | $2,402 | $177,733 | $0 | $0 |
| 2014 | $2,402 | $177,500 | $0 | $0 |
Source: Public Records
Map
Nearby Homes
- 8204 Analee Ave
- 8109 Woodhaven Rd
- 8105 Woodhaven Rd
- 8013 Neighbors Ave
- 8007 Sagramore Rd
- 6303 Fieldvale Rd
- 1704 Chesaco Ave
- 1619 Rosewick Ave
- 8110 Philadelphia Rd
- 1324 Chapel Hill Dr
- 1813 Hanford Rd
- 5543 Lanham Way
- 1821 Weyburn Rd
- 8109 Philadelphia Rd
- 1239 Hilldale Rd
- 8107 Philadelphia Rd
- 8125 Bartholomew Ct
- 8131 Bartholomew Ct
- 8133 Bartholomew Ct
- 8135 Bartholomew Ct
- 8224 Edwill Ave
- 8301 Analee Ave
- 8302 Analee Ave
- 8222 Edwill Ave
- 8227 Dorset Ave
- 8220 Edwill Ave
- 8219 Edwill Ave
- 1509 National Rd
- 8304 Analee Ave
- 1511 National Rd
- 8218 Analee Ave
- 8303 Analee Ave
- 8303 Analee Ave Unit H
- 8303H Analee Ave
- 8225 Dorset Ave
- 8218 Edwill Ave
- 1507 National Rd
- 8221 Analee Ave
- 8217 Edwill Ave
- 1513 National Rd
Your Personal Tour Guide
Ask me questions while you tour the home.