Estimated Value: $291,707 - $332,000
--
Bed
2
Baths
2,002
Sq Ft
$157/Sq Ft
Est. Value
About This Home
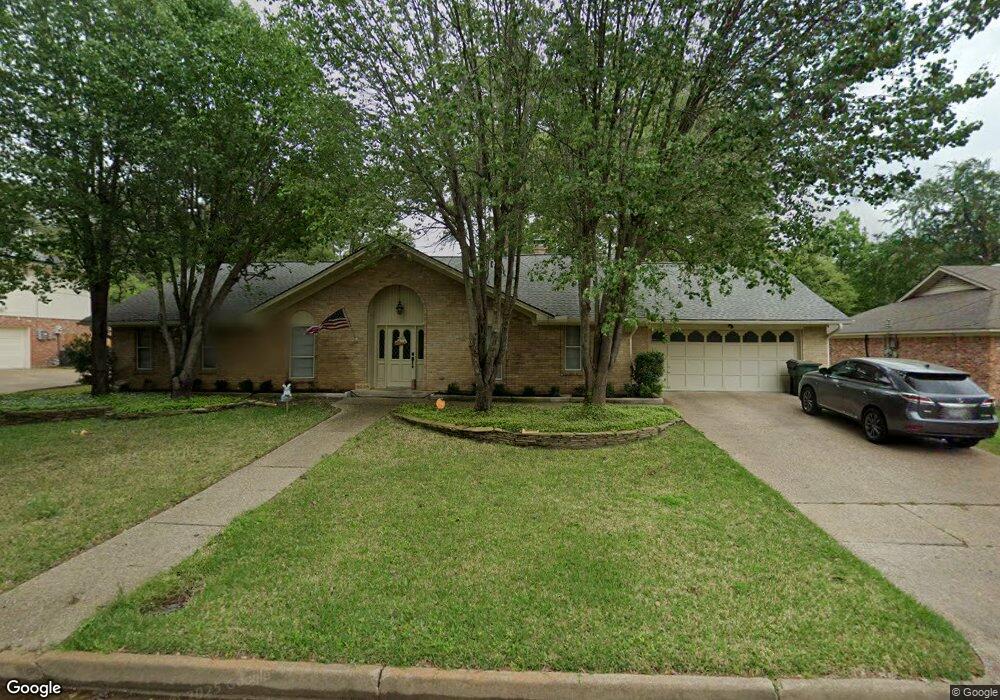
This home is located at 8226 Purdue Dr, Tyler, TX 75703 and is currently estimated at $313,427, approximately $156 per square foot. 8226 Purdue Dr is a home located in Smith County with nearby schools including Rice Elementary School, Hubbard Middle School, and Tyler Legacy High School.
Ownership History
Date
Name
Owned For
Owner Type
Purchase Details
Closed on
Sep 5, 2016
Sold by
Morrison Carla S and Morrison Benjamen T
Bought by
Howard Trever A and Howard Kelly A
Current Estimated Value
Home Financials for this Owner
Home Financials are based on the most recent Mortgage that was taken out on this home.
Original Mortgage
$181,157
Outstanding Balance
$144,009
Interest Rate
3.45%
Mortgage Type
New Conventional
Estimated Equity
$169,418
Purchase Details
Closed on
May 22, 2014
Sold by
Andrews Jenny B and Turner Pat
Bought by
Morrison Benjamin T and Morrison Carla S
Home Financials for this Owner
Home Financials are based on the most recent Mortgage that was taken out on this home.
Original Mortgage
$157,700
Interest Rate
3.25%
Mortgage Type
Adjustable Rate Mortgage/ARM
Create a Home Valuation Report for This Property
The Home Valuation Report is an in-depth analysis detailing your home's value as well as a comparison with similar homes in the area
Home Values in the Area
Average Home Value in this Area
Purchase History
| Date | Buyer | Sale Price | Title Company |
|---|---|---|---|
| Howard Trever A | -- | -- | |
| Morrison Benjamin T | -- | None Available |
Source: Public Records
Mortgage History
| Date | Status | Borrower | Loan Amount |
|---|---|---|---|
| Open | Howard Trever A | $181,157 | |
| Previous Owner | Morrison Benjamin T | $157,700 |
Source: Public Records
Tax History Compared to Growth
Tax History
| Year | Tax Paid | Tax Assessment Tax Assessment Total Assessment is a certain percentage of the fair market value that is determined by local assessors to be the total taxable value of land and additions on the property. | Land | Improvement |
|---|---|---|---|---|
| 2025 | $3,846 | $286,363 | $46,630 | $239,733 |
| 2024 | $3,846 | $283,741 | $38,565 | $258,544 |
| 2023 | $3,460 | $310,214 | $38,565 | $271,649 |
| 2022 | $4,594 | $262,761 | $31,109 | $231,652 |
| 2021 | $4,473 | $213,178 | $31,109 | $182,069 |
| 2020 | $4,574 | $213,766 | $31,109 | $182,657 |
| 2019 | $4,394 | $200,922 | $25,710 | $175,212 |
| 2018 | $4,153 | $190,953 | $25,710 | $165,243 |
| 2017 | $4,077 | $190,953 | $25,710 | $165,243 |
| 2016 | $4,005 | $187,602 | $25,710 | $161,892 |
| 2015 | $3,578 | $181,030 | $25,710 | $155,320 |
| 2014 | $3,578 | $179,940 | $25,710 | $154,230 |
Source: Public Records
Map
Nearby Homes
- 700 Oxford Dr
- 719 Cambridge Bend Cir
- 708 Oxford Cir
- 8310 Columbia Dr
- 202 Ronnette Dr
- 8312 Oxford Dr
- 526 Ronnette Dr
- 8307 Garrett Dr
- 300 Robert e Lee Dr
- 7415 Hollyoak Dr
- 801 Beth Dr
- 308 Canterbury Ct
- 821 Pam Dr
- 219 Powell Dr
- 415 Thigpen Dr
- 411 W Heritage Dr
- 505 Bentley Ct
- 903 Joel Dr
- 915 Pam Dr
- 6522 Emory Ct
- 8228 Purdue Dr
- 8228 8228 Purdue
- 8225 Clemson Dr
- 8224 8224 Purdue
- 8225 8225 Clemson Dr
- 8227 Clemson Dr
- 8221 Clemson Dr
- 8225 8225 Purdue
- 8227 8227 Purdue Dr
- 8225 Purdue Dr
- 8227 Purdue Dr
- 8229 8229 Clemson
- 8230 Purdue Dr
- 8229 Clemson Dr
- 8223 8223 Purdue Dr
- 8223 Purdue Dr
- 8229 Purdue Dr
- 8229 8229 Purdue Dr
- 8217 Clemson Dr
- 103 Clemson Dr