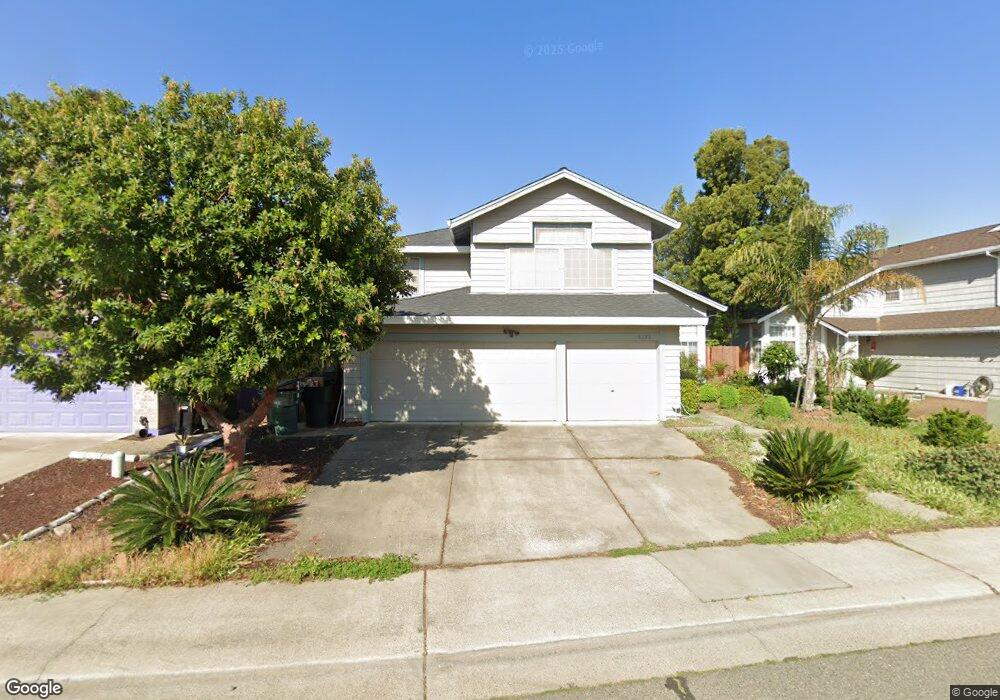
8228 Hardester Dr Sacramento, CA 95828
Estimated Value: $534,000 - $640,000
4
Beds
3
Baths
2,491
Sq Ft
$240/Sq Ft
Est. Value
About This Home
This home is located at 8228 Hardester Dr, Sacramento, CA 95828 and is currently estimated at $597,543, approximately $239 per square foot. 8228 Hardester Dr is a home located in Sacramento County with nearby schools including Raymond Case Elementary School, Edward Harris Jr. Middle School, and Monterey Trail High School.
Ownership History
Date
Name
Owned For
Owner Type
Purchase Details
Closed on
Feb 4, 2019
Sold by
Chu Kin Sang
Bought by
Chu Kin Sang and 2018 Kin Sang Chu Revocable Tr
Current Estimated Value
Purchase Details
Closed on
Jan 28, 2019
Sold by
Luk Samuel
Bought by
Chu Kin Sang
Purchase Details
Closed on
Sep 23, 2010
Sold by
Chu Chu Yuk Ching Lai Yuk Ching Lai and Chu Lai Jade Yuk Ching
Bought by
Luk Samuel
Purchase Details
Closed on
Jan 11, 2001
Sold by
Busath Stephen E and Busath Kathi H
Bought by
Chu Kin Sang and Chu Yuk Ching Lai
Home Financials for this Owner
Home Financials are based on the most recent Mortgage that was taken out on this home.
Original Mortgage
$62,500
Interest Rate
7.65%
Mortgage Type
Stand Alone First
Create a Home Valuation Report for This Property
The Home Valuation Report is an in-depth analysis detailing your home's value as well as a comparison with similar homes in the area
Home Values in the Area
Average Home Value in this Area
Purchase History
| Date | Buyer | Sale Price | Title Company |
|---|---|---|---|
| Chu Kin Sang | -- | None Available | |
| Chu Kin Sang | -- | None Available | |
| Luk Samuel | $90,000 | None Available | |
| Chu Kin Sang | $217,000 | Alliance Title Company |
Source: Public Records
Mortgage History
| Date | Status | Borrower | Loan Amount |
|---|---|---|---|
| Previous Owner | Chu Kin Sang | $62,500 |
Source: Public Records
Tax History
| Year | Tax Paid | Tax Assessment Tax Assessment Total Assessment is a certain percentage of the fair market value that is determined by local assessors to be the total taxable value of land and additions on the property. | Land | Improvement |
|---|---|---|---|---|
| 2025 | $4,140 | $380,993 | $74,746 | $306,247 |
| 2024 | $4,140 | $373,524 | $73,281 | $300,243 |
| 2023 | $4,037 | $366,201 | $71,845 | $294,356 |
| 2022 | $3,968 | $359,022 | $70,437 | $288,585 |
| 2021 | $3,924 | $351,983 | $69,056 | $282,927 |
| 2020 | $3,872 | $348,374 | $68,348 | $280,026 |
| 2019 | $2,953 | $261,392 | $49,975 | $211,417 |
| 2018 | $1,251 | $101,333 | $39,406 | $61,927 |
| 2017 | $1,232 | $99,347 | $38,634 | $60,713 |
| 2016 | $1,178 | $97,400 | $37,877 | $59,523 |
| 2015 | $1,159 | $95,938 | $37,309 | $58,629 |
| 2014 | $1,142 | $94,060 | $36,579 | $57,481 |
Source: Public Records
Map
Nearby Homes
- 8216 Exbourne Cir
- 8163 Morgan Hill Way
- 8233 Short Rd
- 8518 Delahye Cir
- 8329 New Hills Ct
- 8724 Kentshire Way
- 8212 Newbury Park Ct
- 8598 New Valley Way
- 8312 Fintown Ct
- 8239 Derbyshire Cir
- 8775 Brittany Park Dr
- 8775 Liscarney Way
- 8035 Bucks Harbor Way
- 8880 Inisheer Way
- 8794 Frosses Ct
- 8610 Carlisle Ave
- 8009 Parkgate Way
- 8908 Liscarney Way
- 8600 Carlisle Ave
- 8617 Carlisle Ave
- 8234 Hardester Dr
- 8224 Hardester Dr
- 8235 Exbourne Cir
- 8231 Hardester Dr
- 8231 Exbourne Cir
- 8239 Exbourne Cir
- 8201 Exbourne Cir
- 8205 Exbourne Cir
- 8229 Hardester Dr
- 8225 Hardester Dr
- 8243 Exbourne Cir
- 8242 Hardester Dr
- 8233 Hardester Dr
- 8221 Hardester Dr
- 8209 Exbourne Cir
- 8237 Hardester Dr
- 8217 Hardester Dr
- 8247 Exbourne Cir
- 8241 Hardester Dr
Your Personal Tour Guide
Ask me questions while you tour the home.