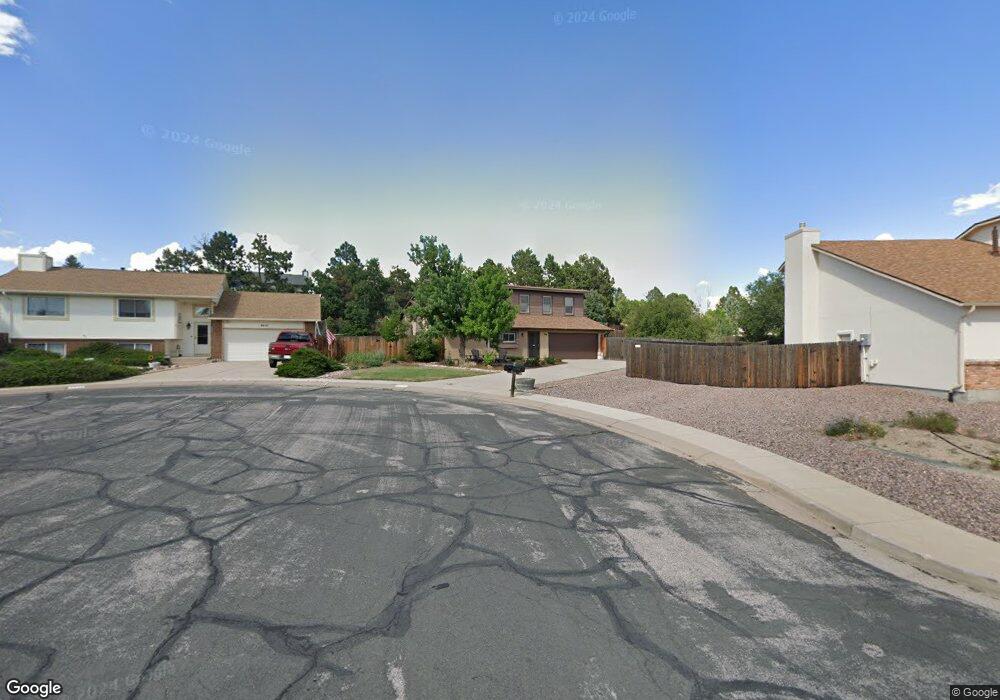
8229 Caravel Dr Colorado Springs, CO 80920
Briargate NeighborhoodEstimated Value: $487,915 - $501,000
3
Beds
2
Baths
1,724
Sq Ft
$287/Sq Ft
Est. Value
About This Home
This home is located at 8229 Caravel Dr, Colorado Springs, CO 80920 and is currently estimated at $494,979, approximately $287 per square foot. 8229 Caravel Dr is a home located in El Paso County with nearby schools including High Plains Elementary School, Mountain Ridge Middle School, and Rampart High School.
Ownership History
Date
Name
Owned For
Owner Type
Purchase Details
Closed on
Jul 5, 2002
Sold by
Brown Randall D and Brown Michelle W
Bought by
Knapp Cara and Knapp Chris H
Current Estimated Value
Home Financials for this Owner
Home Financials are based on the most recent Mortgage that was taken out on this home.
Original Mortgage
$155,600
Outstanding Balance
$66,289
Interest Rate
6.78%
Estimated Equity
$428,690
Purchase Details
Closed on
May 30, 2001
Sold by
Day David L and Day Claudia C
Bought by
Brown Randall D and Brown Michelle W
Home Financials for this Owner
Home Financials are based on the most recent Mortgage that was taken out on this home.
Original Mortgage
$115,000
Interest Rate
6.75%
Purchase Details
Closed on
Aug 2, 1993
Bought by
Knapp Chris H
Purchase Details
Closed on
Dec 1, 1985
Bought by
Knapp Cara
Purchase Details
Closed on
Dec 1, 1982
Bought by
Knapp Chris H
Create a Home Valuation Report for This Property
The Home Valuation Report is an in-depth analysis detailing your home's value as well as a comparison with similar homes in the area
Home Values in the Area
Average Home Value in this Area
Purchase History
| Date | Buyer | Sale Price | Title Company |
|---|---|---|---|
| Knapp Cara | $194,500 | -- | |
| Brown Randall D | $173,600 | Land Title | |
| Knapp Chris H | $127,000 | -- | |
| Knapp Cara | -- | -- | |
| Knapp Chris H | -- | -- |
Source: Public Records
Mortgage History
| Date | Status | Borrower | Loan Amount |
|---|---|---|---|
| Open | Knapp Cara | $155,600 | |
| Previous Owner | Brown Randall D | $115,000 |
Source: Public Records
Tax History Compared to Growth
Tax History
| Year | Tax Paid | Tax Assessment Tax Assessment Total Assessment is a certain percentage of the fair market value that is determined by local assessors to be the total taxable value of land and additions on the property. | Land | Improvement |
|---|---|---|---|---|
| 2025 | $1,879 | $33,330 | -- | -- |
| 2024 | $1,836 | $33,090 | $6,700 | $26,390 |
| 2022 | $1,520 | $21,540 | $5,420 | $16,120 |
| 2021 | $1,584 | $22,170 | $5,580 | $16,590 |
| 2020 | $1,552 | $20,160 | $4,650 | $15,510 |
| 2019 | $1,535 | $20,160 | $4,650 | $15,510 |
| 2018 | $1,321 | $17,040 | $3,600 | $13,440 |
| 2017 | $1,316 | $17,040 | $3,600 | $13,440 |
| 2016 | $1,263 | $16,340 | $3,660 | $12,680 |
| 2015 | $1,261 | $16,340 | $3,660 | $12,680 |
| 2014 | $1,168 | $15,130 | $3,660 | $11,470 |
Source: Public Records
Map
Nearby Homes
- 8213 Caravel Dr
- 3142 Soaring Bird Cir
- 3326 Soaring Bird Cir
- 8112 Old Exchange Dr
- 2768 Thrush Grove
- 2656 Marston Heights
- 3339 Union Jack Way
- 3690 Amelia Island St
- 7849 Flicker Grove
- 2644 Marston Heights
- 8020 Cooper River Dr
- 2340 Winstead View
- 8335 Saint Helena Dr
- 2615 Thrush Grove
- 2730 Kenton Green Ct
- 8118 Ravenel Dr
- 8735 Chapel Square Ct
- 8935 Coberdale Ct
- 3746 St Simons Ct
- 7870 Chimney Terrace
- 8221 Caravel Dr
- 8237 Caravel Dr
- 3075 Windjammer Dr
- 8230 Cutter Terrace
- 3065 Windjammer Dr
- 8220 Cutter Terrace
- 3085 Windjammer Dr
- 8245 Caravel Dr
- 3055 Windjammer Dr
- 3095 Windjammer Dr
- 8205 Caravel Dr
- 8235 Cutter Terrace
- 8210 Cutter Terrace
- 8234 Caravel Dr
- 8242 Caravel Dr
- 8226 Caravel Dr
- 3045 Windjammer Dr
- 8250 Caravel Dr
- 3105 Windjammer Dr
- 8218 Caravel Dr