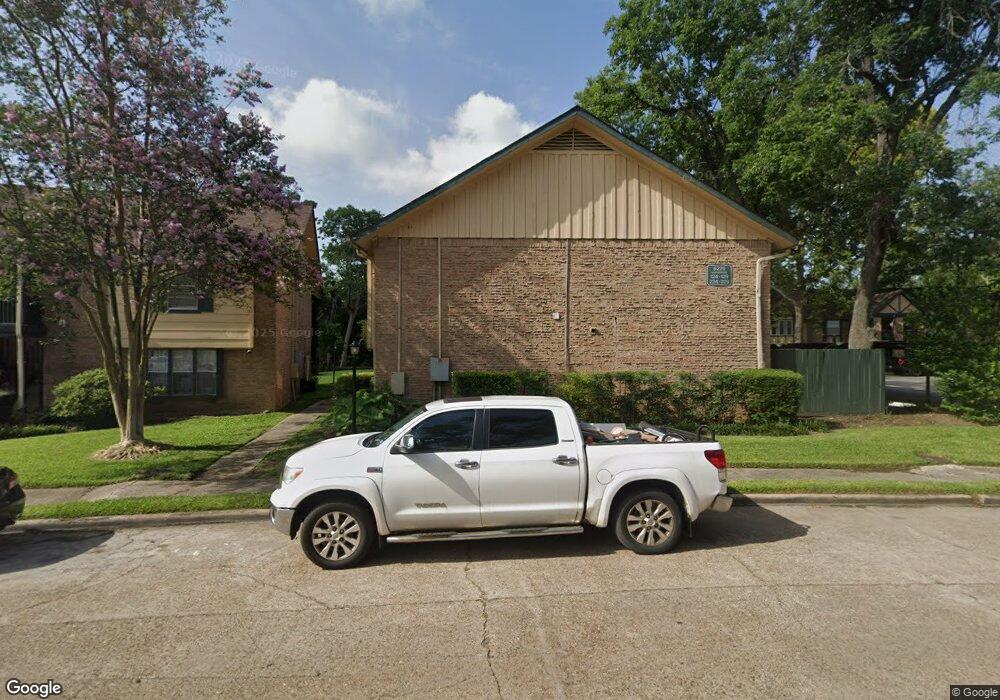
8229 Kingsbrook Rd Unit 128 Houston, TX 77024
Uptown-Galleria District NeighborhoodEstimated Value: $155,000 - $198,000
2
Beds
2
Baths
1,052
Sq Ft
$164/Sq Ft
Est. Value
About This Home
This home is located at 8229 Kingsbrook Rd Unit 128, Houston, TX 77024 and is currently estimated at $172,445, approximately $163 per square foot. 8229 Kingsbrook Rd Unit 128 is a home located in Harris County with nearby schools including Hunters Creek Elementary School, Spring Branch Middle School, and Memorial High School.
Ownership History
Date
Name
Owned For
Owner Type
Purchase Details
Closed on
Feb 15, 2018
Sold by
Falla Mario Garcia
Bought by
Raba Joni
Current Estimated Value
Purchase Details
Closed on
Jan 13, 2016
Sold by
Bloch Debra Ann
Bought by
Falla Mario Garcia
Home Financials for this Owner
Home Financials are based on the most recent Mortgage that was taken out on this home.
Original Mortgage
$118,400
Interest Rate
4.01%
Mortgage Type
New Conventional
Purchase Details
Closed on
Aug 17, 2012
Sold by
Scott Joann Sullivan
Bought by
Bloch Debra Ann
Purchase Details
Closed on
Feb 3, 1998
Sold by
Turner Jeremy Guy
Bought by
Smith Turner Hatice Louise
Home Financials for this Owner
Home Financials are based on the most recent Mortgage that was taken out on this home.
Original Mortgage
$16,400
Interest Rate
6.91%
Purchase Details
Closed on
Jul 19, 1995
Sold by
Mccutchen John W
Bought by
Walton Jacqueline A
Create a Home Valuation Report for This Property
The Home Valuation Report is an in-depth analysis detailing your home's value as well as a comparison with similar homes in the area
Home Values in the Area
Average Home Value in this Area
Purchase History
| Date | Buyer | Sale Price | Title Company |
|---|---|---|---|
| Raba Joni | -- | None Available | |
| Falla Mario Garcia | -- | Tradition Title Co | |
| Bloch Debra Ann | -- | None Available | |
| Smith Turner Hatice Louise | -- | -- | |
| Walton Jacqueline A | -- | Regency Title |
Source: Public Records
Mortgage History
| Date | Status | Borrower | Loan Amount |
|---|---|---|---|
| Previous Owner | Falla Mario Garcia | $118,400 | |
| Previous Owner | Smith Turner Hatice Louise | $16,400 |
Source: Public Records
Tax History Compared to Growth
Tax History
| Year | Tax Paid | Tax Assessment Tax Assessment Total Assessment is a certain percentage of the fair market value that is determined by local assessors to be the total taxable value of land and additions on the property. | Land | Improvement |
|---|---|---|---|---|
| 2025 | $4,371 | $198,283 | $37,674 | $160,609 |
| 2024 | $4,371 | $198,283 | $37,674 | $160,609 |
| 2023 | $4,371 | $174,605 | $33,175 | $141,430 |
| 2022 | $3,998 | $171,026 | $32,495 | $138,531 |
| 2021 | $4,026 | $164,903 | $31,332 | $133,571 |
| 2020 | $4,132 | $164,903 | $31,332 | $133,571 |
| 2019 | $4,317 | $164,903 | $31,332 | $133,571 |
| 2018 | $1,462 | $156,951 | $29,821 | $127,130 |
| 2017 | $3,553 | $135,820 | $25,806 | $110,014 |
| 2016 | $3,307 | $126,424 | $24,021 | $102,403 |
| 2015 | $87 | $108,241 | $20,566 | $87,675 |
| 2014 | $87 | $102,078 | $19,395 | $82,683 |
Source: Public Records
Map
Nearby Homes
- 8229 Kingsbrook Rd Unit 228
- 8229 Kingsbrook Rd Unit 229
- 8223 Kingsbrook Rd Unit 212
- 8277 Kingsbrook Rd Unit 254
- 8287 Kingsbrook Rd Unit 268
- 210 Park Laureate Dr
- 8211 Katy Fwy Unit 42
- 8211 Katy Fwy Unit 23
- 130 Park Laureate Dr
- 750 E Creekside Dr
- 601 Lindenwood Dr
- 764 Kuhlman Rd
- 7807 Bryonwood Dr
- 10426 Memorial Dr
- 1115 Glourie Dr
- 1114 Guinea Dr
- 728 Highgrove Park
- 736 Highgrove Park
- 7603 Edgeway Dr
- 86 S Creekside Ct
- 8229 Kingsbrook Rd Unit 129
- 8229 Kingsbrook Rd Unit 224
- 8229 Kingsbrook Rd Unit 127
- 8229 Kingsbrook Rd Unit 227
- 8229 Kingsbrook Rd Unit 226
- 8229 Kingsbrook Rd Unit 225
- 8229 Kingsbrook Rd Unit 126
- 8229 Kingsbrook Rd Unit 125
- 8229 Kingsbrook Rd Unit 124
- 8229 Kingsbrook Rd
- 8233 Kingsbrook Rd Unit 233
- 8233 Kingsbrook Rd Unit 133
- 8233 Kingsbrook Rd Unit 132
- 8233 Kingsbrook Rd Unit 235
- 8233 Kingsbrook Rd Unit 234
- 8233 Kingsbrook Rd Unit 232
- 8233 Kingsbrook Rd Unit 135
- 8233 Kingsbrook Rd Unit 131
- 8233 Kingsbrook Rd Unit 130
- 8211 Kingsbrook Rd Unit 104