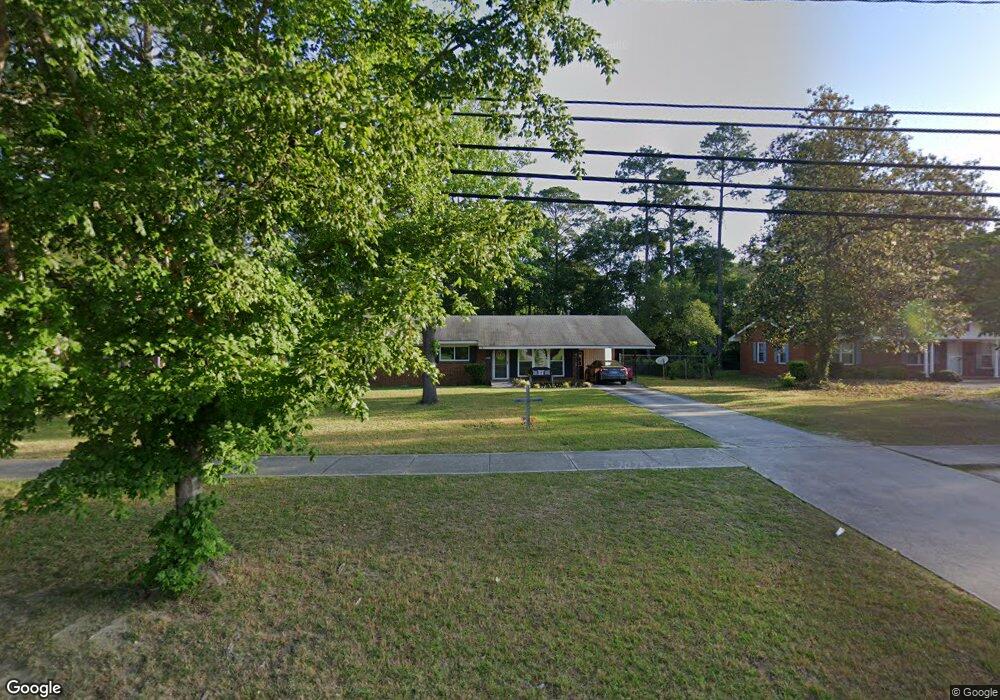
823 8th St W Tifton, GA 31794
Estimated Value: $146,000 - $197,000
3
Beds
2
Baths
1,681
Sq Ft
$106/Sq Ft
Est. Value
About This Home
This home is located at 823 8th St W, Tifton, GA 31794 and is currently estimated at $178,622, approximately $106 per square foot. 823 8th St W is a home located in Tift County with nearby schools including Len Lastinger Primary School, Charles Spencer Elementary School, and J.T. Reddick School.
Ownership History
Date
Name
Owned For
Owner Type
Purchase Details
Closed on
Sep 18, 2006
Sold by
Wang Xiang Yu
Bought by
Reed Margaret and Reed Larry
Current Estimated Value
Home Financials for this Owner
Home Financials are based on the most recent Mortgage that was taken out on this home.
Original Mortgage
$103,377
Outstanding Balance
$61,437
Interest Rate
6.48%
Mortgage Type
New Conventional
Estimated Equity
$117,185
Purchase Details
Closed on
Feb 25, 2003
Sold by
Wang Xian Yu
Bought by
Wang Mei Zhu
Purchase Details
Closed on
Feb 24, 2003
Sold by
Pendarvis Marice J
Bought by
Wang Xian Yu
Purchase Details
Closed on
Aug 11, 1999
Sold by
Hutchinson Cecil W and Hutchinson Sandra
Bought by
Pendarvis Marice J
Purchase Details
Closed on
Jul 20, 1999
Sold by
Holman Mary Jean
Bought by
Hutchinson Cecil W and Hutchinson Sandra E
Purchase Details
Closed on
Jul 30, 1997
Sold by
Carter Thomas Stevens Estate
Bought by
Holman Mary Jean
Create a Home Valuation Report for This Property
The Home Valuation Report is an in-depth analysis detailing your home's value as well as a comparison with similar homes in the area
Home Values in the Area
Average Home Value in this Area
Purchase History
| Date | Buyer | Sale Price | Title Company |
|---|---|---|---|
| Reed Margaret | $105,000 | -- | |
| Wang Mei Zhu | -- | -- | |
| Wang Xian Yu | $82,900 | -- | |
| Pendarvis Marice J | $79,000 | -- | |
| Hutchinson Cecil W | $67,000 | -- | |
| Holman Mary Jean | $65,000 | -- |
Source: Public Records
Mortgage History
| Date | Status | Borrower | Loan Amount |
|---|---|---|---|
| Open | Reed Margaret | $103,377 |
Source: Public Records
Tax History Compared to Growth
Tax History
| Year | Tax Paid | Tax Assessment Tax Assessment Total Assessment is a certain percentage of the fair market value that is determined by local assessors to be the total taxable value of land and additions on the property. | Land | Improvement |
|---|---|---|---|---|
| 2024 | $1,492 | $55,330 | $6,400 | $48,930 |
| 2023 | $1,586 | $44,270 | $4,000 | $40,270 |
| 2022 | $1,666 | $44,270 | $4,000 | $40,270 |
| 2021 | $1,677 | $44,270 | $4,000 | $40,270 |
| 2020 | $1,384 | $35,646 | $4,000 | $31,646 |
| 2019 | $1,384 | $35,646 | $4,000 | $31,646 |
| 2018 | $1,385 | $35,646 | $4,000 | $31,646 |
| 2017 | $1,420 | $35,646 | $4,000 | $31,646 |
| 2016 | $1,422 | $35,646 | $4,000 | $31,646 |
| 2015 | $1,424 | $35,646 | $4,000 | $31,646 |
| 2014 | $1,426 | $35,646 | $4,000 | $31,646 |
| 2013 | -- | $35,646 | $4,000 | $31,646 |
Source: Public Records
Map
Nearby Homes
- 225 Alabama Dr
- 0 Lee Ball Rd
- 0 Penn Place
- 307 Fulwood Blvd
- 711 10th St W
- 523 Alabama Dr Unit 15 & PT 16
- 523 Alabama Dr
- 803 Forest Ave
- 803 Forrest Ave
- 821 Murray Ave
- 416 6th St W
- 1601 Murray Ave
- 801 Ridge Ave N
- 401 Park Ave N
- 1607 Mallard Ln
- 15 acres Us Highway 41
- 33.7 ac Us Highway 41
- 48 acres Us Highway 41
- 2021 Emory Dr
- 1617 Wilson Ave N