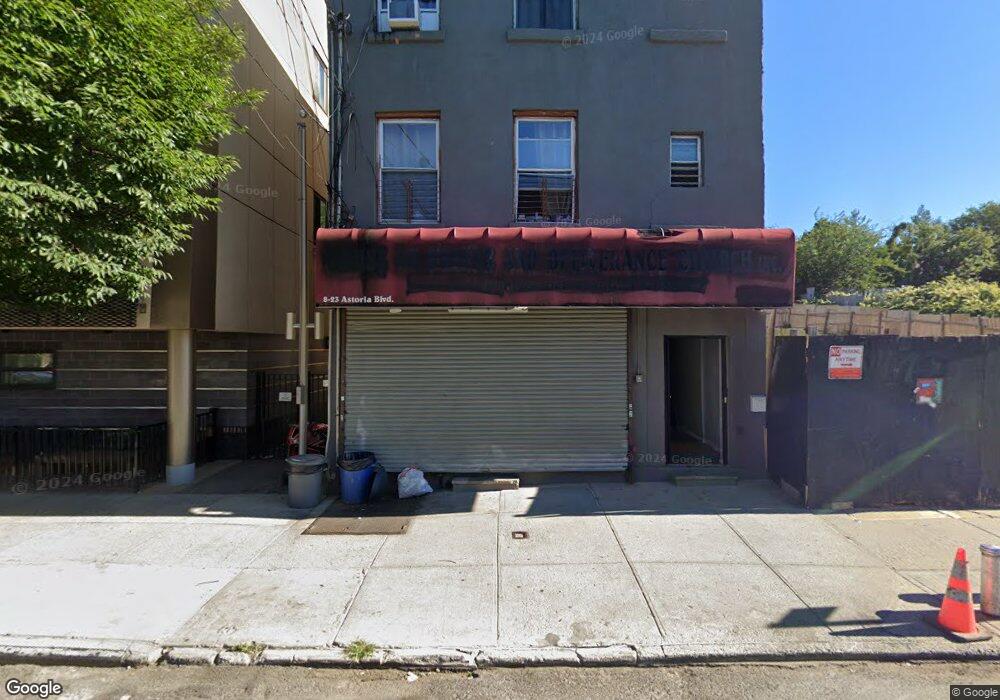
823 Astoria Blvd Long Island City, NY 11102
Astoria NeighborhoodEstimated Value: $1,868,248
5
Beds
3
Baths
3,113
Sq Ft
$600/Sq Ft
Est. Value
About This Home
This home is located at 823 Astoria Blvd, Long Island City, NY 11102 and is currently estimated at $1,868,248, approximately $600 per square foot. 823 Astoria Blvd is a home located in Queens County with nearby schools including P.S. 017 Henry David Thoreau, I.S. 126Q Albert Shanker School Community School, and William Cullen Bryant High School.
Ownership History
Date
Name
Owned For
Owner Type
Purchase Details
Closed on
Jul 31, 2018
Sold by
Costa Juan J
Bought by
384 Nassau Boulevard
Current Estimated Value
Purchase Details
Closed on
May 18, 2018
Sold by
House Of Prayer And Deliverance Ministri and House Of Prayer And Deliverance Inc
Bought by
Costa Juan
Purchase Details
Closed on
Dec 12, 2006
Sold by
Leathers Abraham
Bought by
House Of Prayer And Deliverance Inc
Purchase Details
Closed on
Sep 28, 2006
Sold by
Leathers Christopher
Bought by
Leathers Abraham
Purchase Details
Closed on
Aug 18, 1999
Sold by
Cardillo Carmela
Bought by
Leathers Christopher
Home Financials for this Owner
Home Financials are based on the most recent Mortgage that was taken out on this home.
Original Mortgage
$156,500
Interest Rate
8.15%
Mortgage Type
FHA
Create a Home Valuation Report for This Property
The Home Valuation Report is an in-depth analysis detailing your home's value as well as a comparison with similar homes in the area
Home Values in the Area
Average Home Value in this Area
Purchase History
| Date | Buyer | Sale Price | Title Company |
|---|---|---|---|
| 384 Nassau Boulevard | -- | -- | |
| 384 Nassau Boulevard | -- | -- | |
| Costa Juan | $1,515,000 | -- | |
| Costa Juan | $1,515,000 | -- | |
| House Of Prayer And Deliverance Inc | -- | -- | |
| House Of Prayer And Deliverance Inc | -- | -- | |
| Leathers Abraham | -- | -- | |
| Leathers Abraham | -- | -- | |
| Leathers Christopher | $165,000 | First American Title Ins Co | |
| Leathers Christopher | $165,000 | First American Title Ins Co |
Source: Public Records
Mortgage History
| Date | Status | Borrower | Loan Amount |
|---|---|---|---|
| Previous Owner | Leathers Christopher | $156,500 |
Source: Public Records
Tax History Compared to Growth
Tax History
| Year | Tax Paid | Tax Assessment Tax Assessment Total Assessment is a certain percentage of the fair market value that is determined by local assessors to be the total taxable value of land and additions on the property. | Land | Improvement |
|---|---|---|---|---|
| 2025 | $4,874 | $29,758 | $2,329 | $27,429 |
| 2024 | $4,874 | $24,269 | $1,963 | $22,306 |
| 2023 | $4,599 | $22,896 | $1,928 | $20,968 |
| 2022 | $4,536 | $82,860 | $8,520 | $74,340 |
| 2021 | $4,709 | $76,140 | $8,520 | $67,620 |
| 2020 | $4,538 | $48,480 | $8,520 | $39,960 |
| 2019 | $4,231 | $42,180 | $8,520 | $33,660 |
| 2018 | $3,889 | $19,080 | $4,623 | $14,457 |
| 2017 | $3,860 | $18,936 | $4,889 | $14,047 |
| 2016 | $3,728 | $18,936 | $4,889 | $14,047 |
| 2015 | $2,155 | $17,865 | $6,641 | $11,224 |
| 2014 | $2,155 | $16,854 | $7,526 | $9,328 |
Source: Public Records
Map
Nearby Homes
- 906 27th Ave
- 1151 Welling Ct
- 12-21 30th Ave
- 11-46 Welling Ct
- 1142 Welling Ct
- 30-05 Vernon Blvd Unit 5-K
- 30-05 Vernon Blvd Unit 2-K
- 30-05 Vernon Blvd Unit 5E
- 30-05 Vernon Blvd Unit 2H
- 30-05 Vernon Blvd Unit 5-D
- 30-05 Vernon Blvd Unit 3-D
- 30-05 Vernon Blvd Unit 6E
- 30-05 Vernon Blvd Unit 6-H
- 30-05 Vernon Blvd Unit 5-H
- 30-05 Vernon Blvd Unit 4-J
- 30-05 Vernon Blvd Unit 6-F
- 30-05 Vernon Blvd Unit 6D
- 30-05 Vernon Blvd Unit 3-F
- 30-05 Vernon Blvd Unit 4-H
- 30-05 Vernon Blvd Unit 3-B
- 8-23 Astoria Blvd
- 8-23 Astoria Blvd
- 8-23 Astoria Blvd
- 825 Astoria Blvd
- 827 Astoria Blvd
- 829 Astoria Blvd
- 813 Astoria Blvd
- 8-28 28th Ave
- 8-16 28th Ave
- 28 Astoria Blvd Unit 2
- 28 Astoria Blvd Unit 6
- 28 Astoria Blvd Unit 704
- 28 Astoria Blvd
- 809 Astoria Blvd
- 822 Main Ave
- 11-11 Main Ave
- 28-01 28th Ave
- 28-05 28th Ave
- 807 Astoria Blvd
- 800 Main Ave