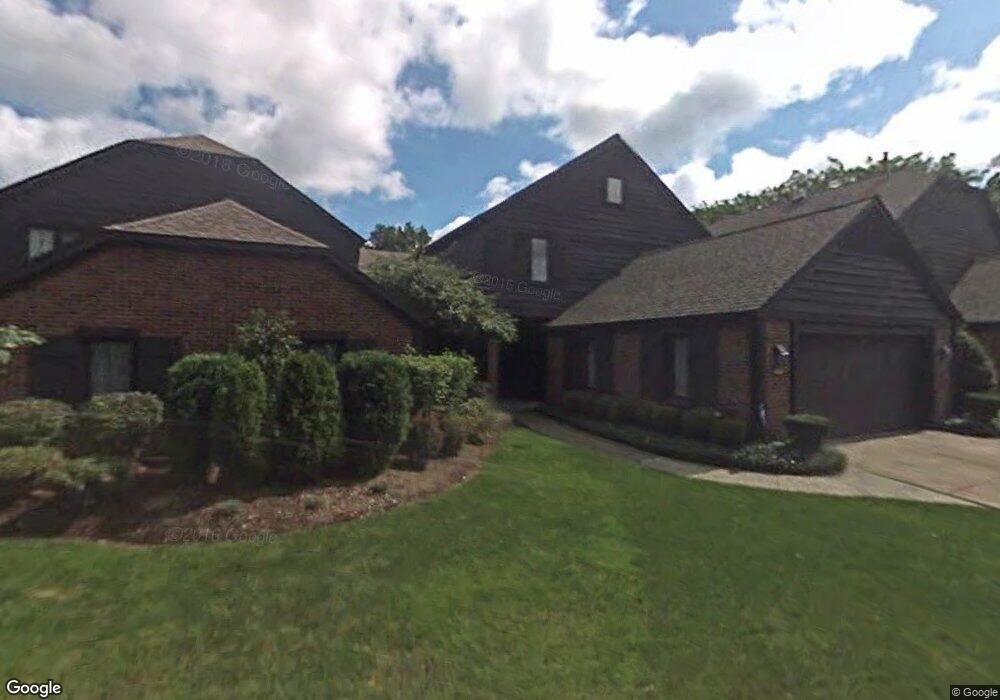
823 Brick Mill Run Westlake, OH 44145
Estimated Value: $354,000 - $419,000
3
Beds
3
Baths
2,250
Sq Ft
$176/Sq Ft
Est. Value
About This Home
This home is located at 823 Brick Mill Run, Westlake, OH 44145 and is currently estimated at $395,778, approximately $175 per square foot. 823 Brick Mill Run is a home located in Cuyahoga County with nearby schools including Westlake Elementary School, Dover Intermediate School, and Lee Burneson Middle School.
Ownership History
Date
Name
Owned For
Owner Type
Purchase Details
Closed on
Jun 17, 1997
Sold by
Mulligan Patrick M
Bought by
Kwiatt Elin S
Current Estimated Value
Home Financials for this Owner
Home Financials are based on the most recent Mortgage that was taken out on this home.
Original Mortgage
$60,000
Outstanding Balance
$8,697
Interest Rate
8.13%
Mortgage Type
New Conventional
Estimated Equity
$387,081
Purchase Details
Closed on
Jul 13, 1995
Sold by
Villar James W
Bought by
Milligan Patrick M and Kavanagh Kathleen M
Home Financials for this Owner
Home Financials are based on the most recent Mortgage that was taken out on this home.
Original Mortgage
$158,000
Interest Rate
7.79%
Mortgage Type
New Conventional
Purchase Details
Closed on
Feb 18, 1983
Bought by
Villar James W and Villar Mary A
Purchase Details
Closed on
Jan 1, 1982
Bought by
Center Ridge Pl Co
Create a Home Valuation Report for This Property
The Home Valuation Report is an in-depth analysis detailing your home's value as well as a comparison with similar homes in the area
Home Values in the Area
Average Home Value in this Area
Purchase History
| Date | Buyer | Sale Price | Title Company |
|---|---|---|---|
| Kwiatt Elin S | $215,000 | -- | |
| Milligan Patrick M | $197,500 | -- | |
| Villar James W | $161,300 | -- | |
| Center Ridge Pl Co | -- | -- |
Source: Public Records
Mortgage History
| Date | Status | Borrower | Loan Amount |
|---|---|---|---|
| Open | Kwiatt Elin S | $60,000 | |
| Previous Owner | Milligan Patrick M | $158,000 |
Source: Public Records
Tax History Compared to Growth
Tax History
| Year | Tax Paid | Tax Assessment Tax Assessment Total Assessment is a certain percentage of the fair market value that is determined by local assessors to be the total taxable value of land and additions on the property. | Land | Improvement |
|---|---|---|---|---|
| 2024 | $5,639 | $128,835 | $12,880 | $115,955 |
| 2023 | $4,777 | $95,380 | $9,560 | $85,820 |
| 2022 | $4,723 | $95,375 | $9,555 | $85,820 |
| 2021 | $4,729 | $95,380 | $9,560 | $85,820 |
| 2020 | $3,845 | $73,360 | $7,350 | $66,010 |
| 2019 | $3,728 | $209,600 | $21,000 | $188,600 |
| 2018 | $3,514 | $73,360 | $7,350 | $66,010 |
| 2017 | $3,318 | $62,590 | $6,270 | $56,320 |
| 2016 | $3,300 | $62,590 | $6,270 | $56,320 |
| 2015 | $4,105 | $62,590 | $6,270 | $56,320 |
| 2014 | $4,105 | $74,490 | $7,460 | $67,030 |
Source: Public Records
Map
Nearby Homes
- 851 Brick Mill Run Unit 10
- 700 Brick Mill Run Unit 406
- 22576 Peach Tree Ln
- 7 Pond Dr
- 1330 E Melrose Dr
- 1301 Clague Rd
- 22722 Lake Rd
- 22728 Lake Rd
- 22700 Lake Rd Unit 204
- 22700 Lake Rd Unit 305
- 22700 Lake Rd Unit 406
- 22700 Lake Rd Unit 306
- 22700 Lake Rd Unit 405
- 22700 Lake Rd Unit 304
- 22700 Lake Rd Unit 504
- 22700 Lake Rd Unit 102
- 23200 Lake Rd Unit 50
- 23200 Lake Rd Unit 47
- 23200 Lake Rd Unit 30
- 1055 Medfield Dr
- 819 Brick Mill Run Unit TH17
- 815 Brick Mill Run Unit 18
- 827 Brick Mill Run
- 789 Brick Mill Run Unit 3
- 793 Brick Mill Run Unit D2
- 789 Brick Mill Run Unit C1
- 781 Brick Mill Run
- 797 Brick Mill Run
- 797 Brick Mill Run Unit 1
- 800 Brick Mill Run Unit 519
- 800 Brick Mill Run Unit 513
- 800 Brick Mill Run Unit 401
- 800 Brick Mill Run Unit 621
- 800 Brick Mill Run Unit 516
- 800 Brick Mill Run
- 800 Brick Mill Run Unit 309
- 800 Brick Mill Run Unit 418
- 800 Brick Mill Run Unit 607
- 800 Brick Mill Run Unit 303
- 800 Brick Mill Run Unit 615