Estimated Value: $147,000 - $179,000
3
Beds
1
Bath
1,267
Sq Ft
$124/Sq Ft
Est. Value
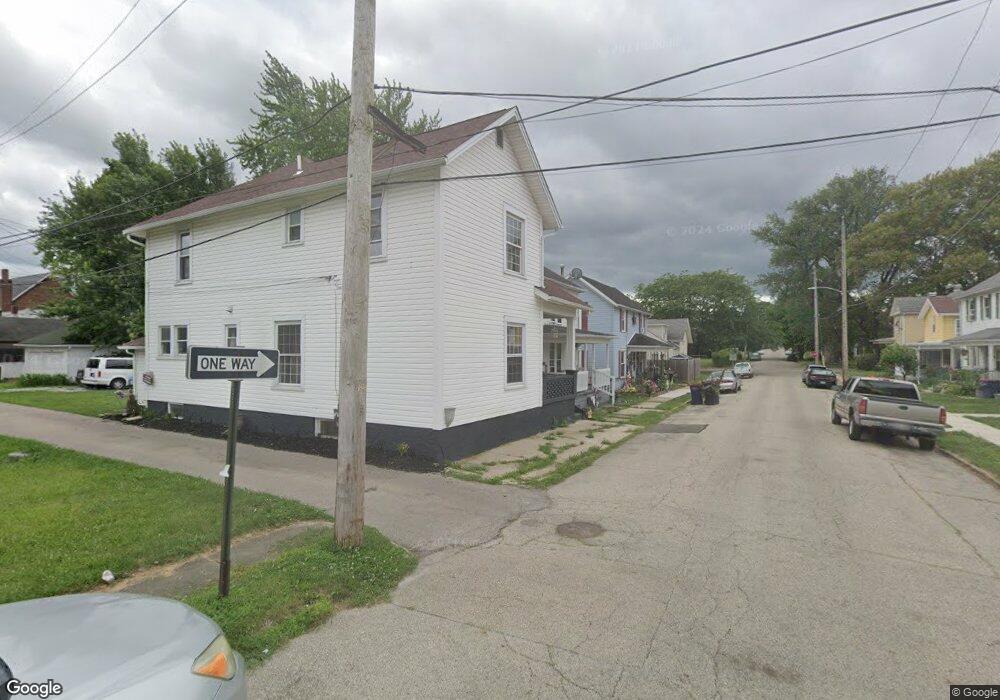
About This Home
This home is located at 823 Caldwell St, Piqua, OH 45356 and is currently estimated at $157,685, approximately $124 per square foot. 823 Caldwell St is a home located in Miami County with nearby schools including Piqua Central Intermediate School, Springcreek Primary School, and Piqua Junior High School.
Ownership History
Date
Name
Owned For
Owner Type
Purchase Details
Closed on
Jun 22, 2010
Sold by
Secretary Of Housing & Urban Development
Bought by
Storm Investments Llc
Current Estimated Value
Purchase Details
Closed on
Feb 9, 2010
Sold by
National City Bank
Bought by
Secretary Of Housing & Urban Development
Purchase Details
Closed on
Dec 11, 2009
Sold by
Brown Christopher A and Brown Jami L
Bought by
National City Bank
Purchase Details
Closed on
May 25, 2004
Sold by
Walls Jenifer L Mccloud
Bought by
Brown Christopher A and Brown Jami L
Purchase Details
Closed on
Dec 14, 1998
Sold by
Pack William R and Pack Mary Jo
Bought by
Mccloud Jenifer L
Create a Home Valuation Report for This Property
The Home Valuation Report is an in-depth analysis detailing your home's value as well as a comparison with similar homes in the area
Home Values in the Area
Average Home Value in this Area
Purchase History
| Date | Buyer | Sale Price | Title Company |
|---|---|---|---|
| Storm Investments Llc | -- | -- | |
| Secretary Of Housing & Urban Development | -- | -- | |
| National City Bank | $40,000 | -- | |
| Brown Christopher A | $75,000 | -- | |
| Mccloud Jenifer L | $66,000 | -- |
Source: Public Records
Mortgage History
| Date | Status | Borrower | Loan Amount |
|---|---|---|---|
| Closed | Mccloud Jenifer L | $0 |
Source: Public Records
Tax History
| Year | Tax Paid | Tax Assessment Tax Assessment Total Assessment is a certain percentage of the fair market value that is determined by local assessors to be the total taxable value of land and additions on the property. | Land | Improvement |
|---|---|---|---|---|
| 2025 | $1,592 | $38,440 | $6,690 | $31,750 |
| 2024 | $1,592 | $30,110 | $7,180 | $22,930 |
| 2023 | $1,469 | $30,110 | $7,180 | $22,930 |
| 2022 | $1,392 | $30,110 | $7,180 | $22,930 |
| 2021 | $1,184 | $23,170 | $5,530 | $17,640 |
| 2020 | $1,166 | $23,170 | $5,530 | $17,640 |
| 2019 | $1,171 | $23,170 | $5,530 | $17,640 |
| 2018 | $985 | $18,240 | $5,740 | $12,500 |
| 2017 | $996 | $18,240 | $5,740 | $12,500 |
| 2016 | $987 | $18,240 | $5,740 | $12,500 |
| 2015 | $972 | $17,540 | $5,530 | $12,010 |
| 2014 | $972 | $17,540 | $5,530 | $12,010 |
| 2013 | $975 | $17,540 | $5,530 | $12,010 |
Source: Public Records
Map
Nearby Homes
- 412 Camp St
- 931 Caldwell St
- 419 Riverside Dr
- 651 N Downing St Unit 8
- 107 Riverside Dr
- 454 Riverside Dr
- 522 W North St
- 615 N Wayne St
- 630 Boone St
- 333 W Greene St
- 651 Boone St
- 423 N Wayne St
- 505 Scott St
- 735 Park Ave
- 523 Harrison St
- 908 Camp St
- 924 W North St
- 211 Franklin St
- 825 W Greene St
- 1307 Walker St
Your Personal Tour Guide
Ask me questions while you tour the home.