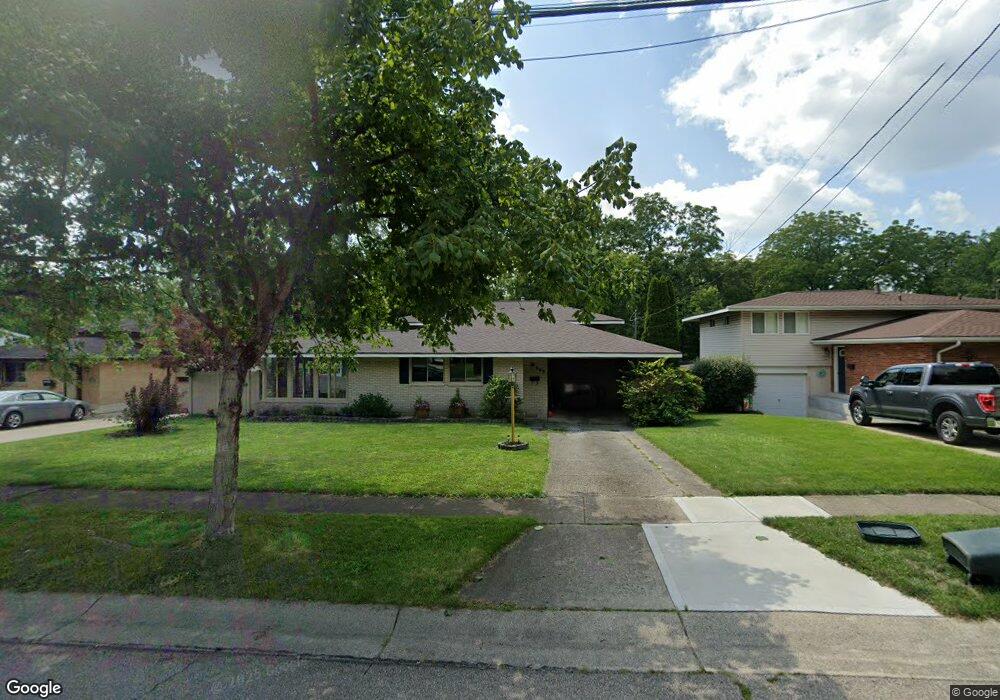
823 Cascade Rd Cincinnati, OH 45240
Estimated Value: $240,932 - $271,000
3
Beds
2
Baths
2,153
Sq Ft
$119/Sq Ft
Est. Value
About This Home
This home is located at 823 Cascade Rd, Cincinnati, OH 45240 and is currently estimated at $256,483, approximately $119 per square foot. 823 Cascade Rd is a home located in Hamilton County with nearby schools including Calvary Academy- The.
Ownership History
Date
Name
Owned For
Owner Type
Purchase Details
Closed on
Sep 16, 2024
Sold by
Denzler Diane M
Bought by
Diane M Denzler Family Trust and Denzler
Current Estimated Value
Purchase Details
Closed on
Dec 28, 2001
Sold by
Stinebuck Daniel P and Stinebuck Lisa G
Bought by
Denzler Diane M
Purchase Details
Closed on
May 31, 1995
Sold by
Swank Thomas C and Swank Yolanda M
Bought by
Stinebuck Daniel P
Home Financials for this Owner
Home Financials are based on the most recent Mortgage that was taken out on this home.
Original Mortgage
$79,650
Interest Rate
8.26%
Create a Home Valuation Report for This Property
The Home Valuation Report is an in-depth analysis detailing your home's value as well as a comparison with similar homes in the area
Home Values in the Area
Average Home Value in this Area
Purchase History
| Date | Buyer | Sale Price | Title Company |
|---|---|---|---|
| Diane M Denzler Family Trust | -- | None Listed On Document | |
| Diane M Denzler Family Trust | -- | None Listed On Document | |
| Diane M Denzler Family Trust | -- | None Listed On Document | |
| Denzler Diane M | $129,900 | -- | |
| Stinebuck Daniel P | -- | -- |
Source: Public Records
Mortgage History
| Date | Status | Borrower | Loan Amount |
|---|---|---|---|
| Previous Owner | Stinebuck Daniel P | $79,650 |
Source: Public Records
Tax History
| Year | Tax Paid | Tax Assessment Tax Assessment Total Assessment is a certain percentage of the fair market value that is determined by local assessors to be the total taxable value of land and additions on the property. | Land | Improvement |
|---|---|---|---|---|
| 2025 | $3,424 | $58,181 | $9,622 | $48,559 |
| 2024 | $3,332 | $58,181 | $9,622 | $48,559 |
| 2023 | $3,378 | $58,181 | $9,622 | $48,559 |
| 2022 | $2,904 | $37,863 | $8,561 | $29,302 |
| 2021 | $2,836 | $37,863 | $8,561 | $29,302 |
| 2020 | $2,873 | $37,863 | $8,561 | $29,302 |
| 2019 | $2,726 | $31,553 | $7,133 | $24,420 |
| 2018 | $2,732 | $31,553 | $7,133 | $24,420 |
| 2017 | $2,629 | $31,553 | $7,133 | $24,420 |
| 2016 | $2,757 | $32,418 | $7,529 | $24,889 |
| 2015 | $2,636 | $32,418 | $7,529 | $24,889 |
| 2014 | $2,361 | $32,418 | $7,529 | $24,889 |
| 2013 | $2,434 | $34,122 | $7,924 | $26,198 |
Source: Public Records
Map
Nearby Homes
- 16 Japonica Dr
- 38 Handel Ln
- 1 Jennings Rd
- 37 Hayden Dr
- 34 Gambier Cir
- 564 Waycross Rd
- 602 Brightview Place Unit 34
- 612 Brightview Place Unit 30
- 614 Brightview Place Unit 29
- 626 Brightview Place Unit 24
- 622 Brightview Place Unit 26
- 620 Brightview Place Unit 27
- 624 Brightview Place Unit 25
- 1013 Ligorio Ave
- 31 Flanders Ln
- 920 Waycross Rd
- 11 Dewitt Ct
- 6 Chalmers Ct
- 9 Dewitt Ct
- 1105 Inner Circle Dr
- 821 Cascade Rd
- 825 Cascade Rd
- 819 Cascade Rd
- 827 Cascade Rd
- 822 Cascade Rd
- 826 Cascade Rd
- 817 Cascade Rd
- 829 Cascade Rd
- 820 Cascade Rd
- 828 Cascade Rd
- 818 Cascade Rd
- 815 Cascade Rd
- 831 Cascade Rd
- 830 Cascade Rd
- 10857 Carnegie Dr
- 10849 Carnegie Dr
- 816 Cascade Rd
- 10861 Carnegie Dr
- 10841 Carnegie Dr
- 10869 Carnegie Dr
Your Personal Tour Guide
Ask me questions while you tour the home.