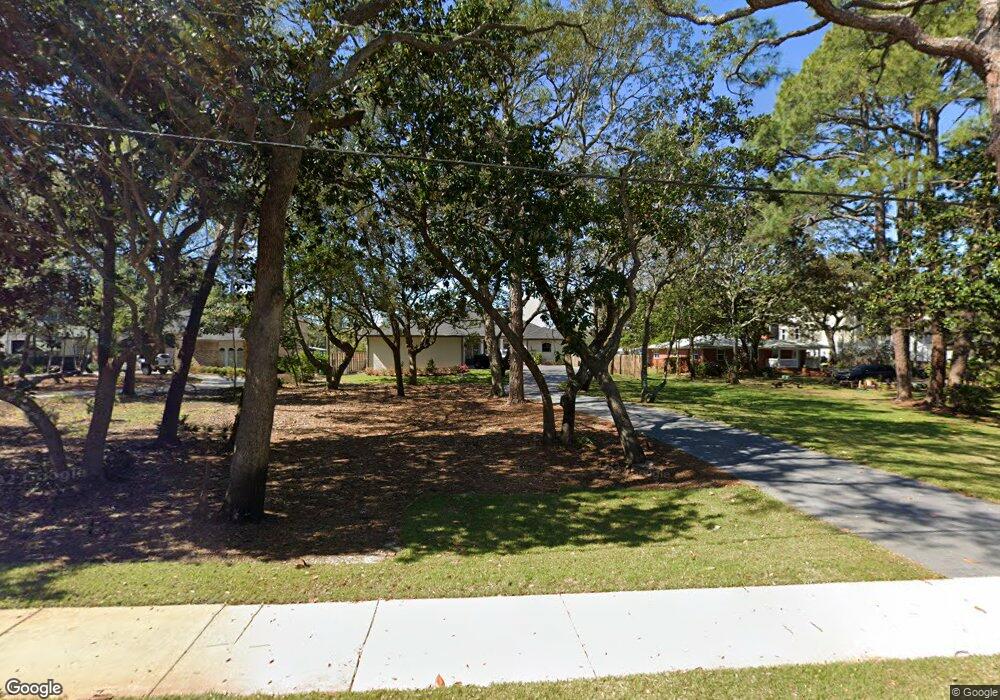
823 Cross St Destin, FL 32541
Estimated Value: $1,272,000 - $2,065,686
4
Beds
4
Baths
3,229
Sq Ft
$466/Sq Ft
Est. Value
About This Home
This home is located at 823 Cross St, Destin, FL 32541 and is currently estimated at $1,505,172, approximately $466 per square foot. 823 Cross St is a home located in Okaloosa County with nearby schools including Destin Elementary School, Destin Middle School, and Fort Walton Beach High School.
Ownership History
Date
Name
Owned For
Owner Type
Purchase Details
Closed on
Dec 14, 2023
Sold by
Causton Benjamin and Causton Nichole
Bought by
Causton Family Revocable Trust
Current Estimated Value
Purchase Details
Closed on
Apr 3, 2020
Sold by
Colt Development Llc
Bought by
Causton Benjamin and Caustom Nichole
Home Financials for this Owner
Home Financials are based on the most recent Mortgage that was taken out on this home.
Original Mortgage
$420,000
Interest Rate
3.4%
Mortgage Type
Commercial
Purchase Details
Closed on
Nov 15, 2019
Sold by
Sauer Jacob A and Sauer Shane G
Bought by
Colt Development Llc
Create a Home Valuation Report for This Property
The Home Valuation Report is an in-depth analysis detailing your home's value as well as a comparison with similar homes in the area
Home Values in the Area
Average Home Value in this Area
Purchase History
| Date | Buyer | Sale Price | Title Company |
|---|---|---|---|
| Causton Family Revocable Trust | $100 | None Listed On Document | |
| Causton Benjamin | $525,000 | Mcgill Escrow & Title Llc | |
| Colt Development Llc | $355,000 | Attorney |
Source: Public Records
Mortgage History
| Date | Status | Borrower | Loan Amount |
|---|---|---|---|
| Previous Owner | Causton Benjamin | $420,000 |
Source: Public Records
Tax History
| Year | Tax Paid | Tax Assessment Tax Assessment Total Assessment is a certain percentage of the fair market value that is determined by local assessors to be the total taxable value of land and additions on the property. | Land | Improvement |
|---|---|---|---|---|
| 2025 | $16,245 | $1,410,655 | -- | -- |
| 2024 | $15,440 | $1,370,899 | -- | -- |
| 2023 | $15,440 | $1,330,970 | $0 | $0 |
| 2022 | $15,109 | $1,292,204 | $0 | $0 |
| 2021 | $5,151 | $414,760 | $414,760 | $0 |
| 2020 | $5,019 | $401,120 | $396,000 | $5,120 |
| 2019 | $6,382 | $503,107 | $353,121 | $149,986 |
| 2018 | $1,857 | $182,240 | $0 | $0 |
| 2017 | $1,844 | $178,492 | $0 | $0 |
| 2016 | $1,794 | $174,821 | $0 | $0 |
| 2015 | $1,819 | $173,606 | $0 | $0 |
| 2014 | $1,825 | $172,228 | $0 | $0 |
Source: Public Records
Map
Nearby Homes
- 709 Vintage Ct
- 425 Stahlman Ave
- 332 Calhoun Ave
- 117 Fletcher Way
- 115 Fletcher Way
- 113 Fletcher Way
- 104 Fletcher Way
- 103 Fletcher Way
- 808 Willow St
- 1190 Bay Ct
- 4 Lots 1st St
- Lot 12 1st St
- 314 Stahlman Ave
- 434 Fleshman Dr
- TBD Kelly St
- 301 Primrose Cir
- 901 Peacocks Point Dr
- 515 First Ave
- 615 Beach Dr
- 515 Beach Dr
Your Personal Tour Guide
Ask me questions while you tour the home.