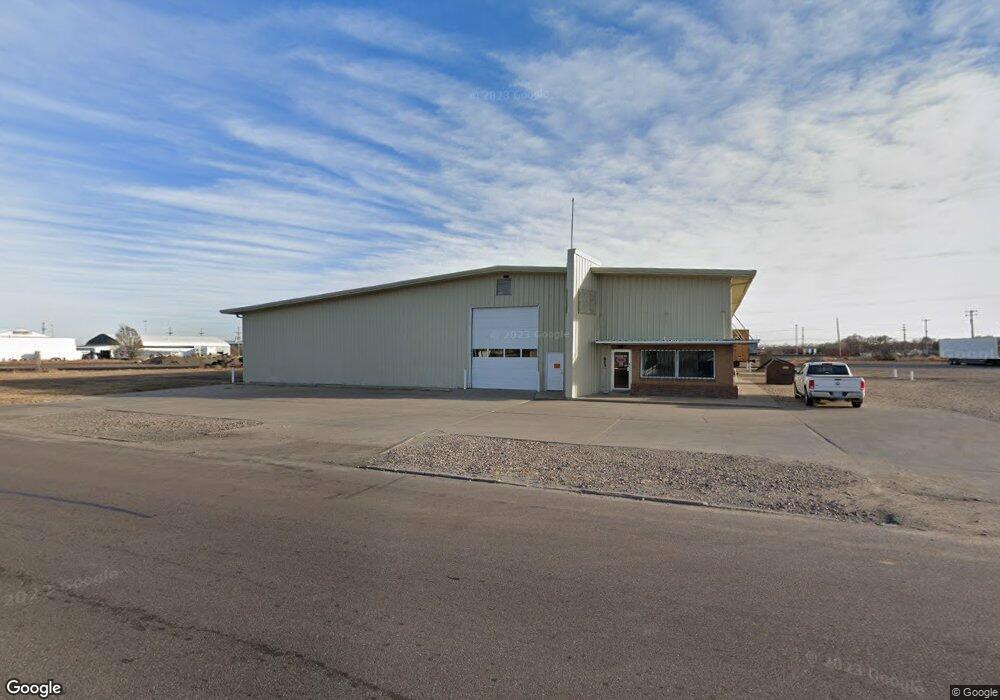
823 E 4th St Grand Island, NE 68801
Estimated Value: $235,000
--
Bed
2
Baths
13,200
Sq Ft
$18/Sq Ft
Est. Value
About This Home
This home is located at 823 E 4th St, Grand Island, NE 68801 and is currently priced at $235,000, approximately $17 per square foot. 823 E 4th St is a home located in Hall County with nearby schools including Lincoln Elementary School, Walnut Middle School, and Grand Island Senior High School.
Ownership History
Date
Name
Owned For
Owner Type
Purchase Details
Closed on
Jun 27, 2014
Sold by
Hamilton Robert H
Bought by
Blender Llc
Current Estimated Value
Home Financials for this Owner
Home Financials are based on the most recent Mortgage that was taken out on this home.
Original Mortgage
$350,000
Outstanding Balance
$267,293
Interest Rate
4.23%
Mortgage Type
Future Advance Clause Open End Mortgage
Purchase Details
Closed on
Mar 4, 2003
Sold by
Snyder Robert H and Snyder Bernice A
Bought by
Snyder Bernice A
Create a Home Valuation Report for This Property
The Home Valuation Report is an in-depth analysis detailing your home's value as well as a comparison with similar homes in the area
Home Values in the Area
Average Home Value in this Area
Purchase History
| Date | Buyer | Sale Price | Title Company |
|---|---|---|---|
| Blender Llc | $278,000 | Grand Island Abstract Escrow | |
| Snyder Bernice A | -- | -- |
Source: Public Records
Mortgage History
| Date | Status | Borrower | Loan Amount |
|---|---|---|---|
| Open | Blender Llc | $350,000 |
Source: Public Records
Tax History Compared to Growth
Tax History
| Year | Tax Paid | Tax Assessment Tax Assessment Total Assessment is a certain percentage of the fair market value that is determined by local assessors to be the total taxable value of land and additions on the property. | Land | Improvement |
|---|---|---|---|---|
| 2024 | $3,597 | $247,848 | $70,020 | $177,828 |
| 2023 | $4,504 | $247,848 | $70,020 | $177,828 |
| 2022 | $5,583 | $277,828 | $100,000 | $177,828 |
| 2021 | $5,648 | $276,923 | $100,000 | $176,923 |
| 2020 | $4,798 | $276,923 | $100,000 | $176,923 |
| 2019 | $4,876 | $231,315 | $86,250 | $145,065 |
| 2017 | $4,915 | $227,090 | $86,250 | $140,840 |
| 2016 | $4,732 | $227,090 | $86,250 | $140,840 |
| 2015 | $4,634 | $219,050 | $86,250 | $132,800 |
| 2014 | $4,809 | $219,050 | $86,250 | $132,800 |
Source: Public Records
Map
Nearby Homes