823 E Cherry St Olney, IL 62450
Olney AreaEstimated Value: $52,791 - $101,000
About This Home
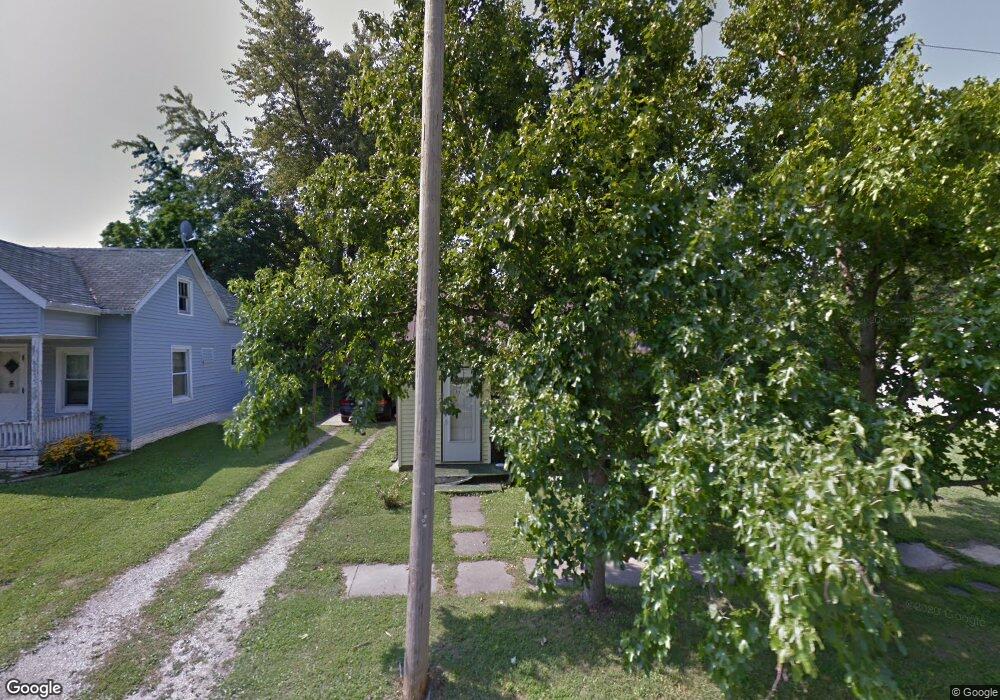
This home is located at 823 E Cherry St, Olney, IL 62450 and is currently estimated at $70,698. 823 E Cherry St is a home with nearby schools including Richland County Elementary School, Richland County Middle School, and Richland County High School.
Ownership History
We collect this data history from publicly available records. To have your information removed, we recommend requesting removal directly through your county’s website.
Purchase Details
Purchase Details
Home Financials for this Owner
Home Financials are based on the most recent Mortgage that was taken out on this home.Home Values in the Area
Average Home Value in this Area
Purchase History
We collect this data history from publicly available records. To have your information removed, we recommend requesting removal directly through your county’s website.
| Date | Buyer | Sale Price | Title Company |
|---|---|---|---|
| -- | -- | ||
| -- | -- |
Mortgage History
We collect this data history from publicly available records. To have your information removed, we recommend requesting removal directly through your county’s website.
| Date | Status | Borrower | Loan Amount |
|---|---|---|---|
| Open | $25,000 | ||
| Closed | $21,000 | ||
| Previous Owner | $18,231 |
Tax History
We collect this data history from publicly available records. To have your information removed, we recommend requesting removal directly through your county’s website.
| Year | Tax Paid | Tax Assessment Tax Assessment Total Assessment is a certain percentage of the fair market value that is determined by local assessors to be the total taxable value of land and additions on the property. | Land | Improvement |
|---|---|---|---|---|
| 2025 | $271 | $9,651 | $3,769 | $5,882 |
| 2024 | $264 | $9,105 | $3,556 | $5,549 |
| 2023 | $271 | $8,431 | $3,293 | $5,138 |
| 2022 | $279 | $7,806 | $3,049 | $4,757 |
| 2021 | $294 | $7,434 | $2,904 | $4,530 |
| 2020 | $297 | $7,288 | $2,847 | $4,441 |
| 2019 | $300 | $7,288 | $2,847 | $4,441 |
| 2018 | $296 | $7,288 | $2,847 | $4,441 |
| 2017 | $294 | $7,216 | $2,819 | $4,397 |
| 2016 | $297 | $6,873 | $2,685 | $4,188 |
| 2015 | $300 | $6,609 | $2,582 | $4,027 |
| 2014 | $293 | $6,479 | $2,531 | $3,948 |
| 2013 | $286 | $5,933 | $2,318 | $3,615 |
Map
- 530 S East St
- 601 E Lafayette St
- 1205 E Main St
- 1306 E Chestnut St
- 910 E Butler St
- 303 N Ohio St
- 439 E Glenwood Ave
- 1104 S Maple St
- 125 E Glenwood Ave
- 216 E Franklin St
- 401 & 407 W Chestnut St
- 2303 Mimosa Dr
- 108 N Saratoga St
- 1207 S Baltimore St
- 1314 Jonathan Dr
- 1104 N Van St
- 613 Ash St
- 403 N West St
- 108 E Mack Ave
- 1717 Mary Ln
- 824 E North Ave
- 816 E North Ave
- 904 E North Ave
- 420 S Jefferson St
- 819 E North St
- 913 E North Ave
- 908 E North Ave
- 917 E North Ave
- 802 E North Ave
- 819 E North Ave
- 903 E North Ave
- 809 E North Ave
- 815 E North Ave
- 912 E North Ave
- 909 E North Ave
- 825 E Cherry St
- 400 S Jefferson St
- 803 E North Ave
- 803 E North St
- 907 E Cherry St
Ask me questions while you tour the home.