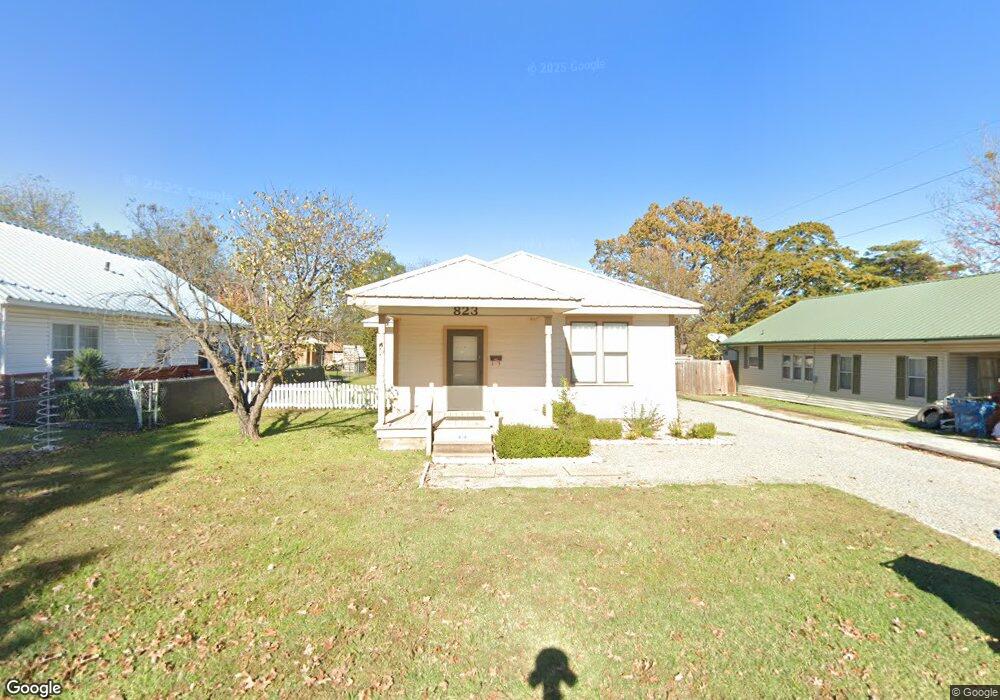
823 E Osage Ave McAlester, OK 74501
Estimated Value: $99,000 - $105,000
3
Beds
1
Bath
1,264
Sq Ft
$80/Sq Ft
Est. Value
About This Home
This home is located at 823 E Osage Ave, McAlester, OK 74501 and is currently estimated at $101,642, approximately $80 per square foot. 823 E Osage Ave is a home located in Pittsburg County with nearby schools including McAlester High School, Mcalester Christian Academy, and Lakewood Christian School.
Ownership History
Date
Name
Owned For
Owner Type
Purchase Details
Closed on
Aug 31, 2018
Sold by
Delana Shawn and Delana Jennifer
Bought by
Baldwin Ronna G
Current Estimated Value
Home Financials for this Owner
Home Financials are based on the most recent Mortgage that was taken out on this home.
Original Mortgage
$52,000
Outstanding Balance
$45,066
Interest Rate
4.5%
Mortgage Type
New Conventional
Estimated Equity
$56,576
Purchase Details
Closed on
Aug 19, 2008
Sold by
Delana Jim and Delana Shawn
Bought by
Delana Shawn
Home Financials for this Owner
Home Financials are based on the most recent Mortgage that was taken out on this home.
Original Mortgage
$50,650
Interest Rate
6.66%
Mortgage Type
Future Advance Clause Open End Mortgage
Purchase Details
Closed on
Jul 7, 2006
Sold by
Delana Violet May and Delana Jimmie R
Bought by
Delana Jim and Delana Shawn
Purchase Details
Closed on
Mar 4, 2000
Sold by
Moon Glen
Bought by
Delana Jim
Create a Home Valuation Report for This Property
The Home Valuation Report is an in-depth analysis detailing your home's value as well as a comparison with similar homes in the area
Home Values in the Area
Average Home Value in this Area
Purchase History
| Date | Buyer | Sale Price | Title Company |
|---|---|---|---|
| Baldwin Ronna G | $65,000 | Multiple Title | |
| Delana Shawn | -- | None Available | |
| Delana Jim | -- | None Available | |
| Delana Jim | $17,500 | -- |
Source: Public Records
Mortgage History
| Date | Status | Borrower | Loan Amount |
|---|---|---|---|
| Open | Baldwin Ronna G | $52,000 | |
| Previous Owner | Delana Shawn | $50,650 |
Source: Public Records
Tax History Compared to Growth
Tax History
| Year | Tax Paid | Tax Assessment Tax Assessment Total Assessment is a certain percentage of the fair market value that is determined by local assessors to be the total taxable value of land and additions on the property. | Land | Improvement |
|---|---|---|---|---|
| 2024 | $522 | $5,995 | $1,018 | $4,977 |
| 2023 | $526 | $6,701 | $1,018 | $5,683 |
| 2022 | $587 | $6,701 | $1,018 | $5,683 |
| 2021 | $583 | $6,701 | $1,018 | $5,683 |
| 2020 | $587 | $6,701 | $1,018 | $5,683 |
| 2019 | $576 | $7,151 | $1,018 | $6,133 |
| 2018 | $139 | $2,724 | $472 | $2,252 |
| 2017 | $134 | $2,644 | $458 | $2,186 |
| 2016 | $127 | $2,568 | $445 | $2,123 |
| 2015 | $111 | $2,492 | $446 | $2,046 |
| 2014 | $185 | $2,492 | $446 | $2,046 |
Source: Public Records
Map
Nearby Homes
- 800 S 9th St
- 810 E Miami Ave
- 903 E Miami Ave
- 1004 E Osage Ave
- 0 E Seminole Ave
- 1020 S 6th St
- 621 E Seminole Ave
- 602 E Seneca Ave
- 602 E Comanche Ave
- 512 E Miami Ave
- 1002 E Creek Ave
- 525 E Seminole Ave
- 610 S Strong Blvd
- 703 S 12th St
- 617 S 12th St
- 703 S 5th St
- 802 E Delaware Ave
- 1306 S 6th St
- 1204 E Comanche Ave
- 803 E Delaware Ave