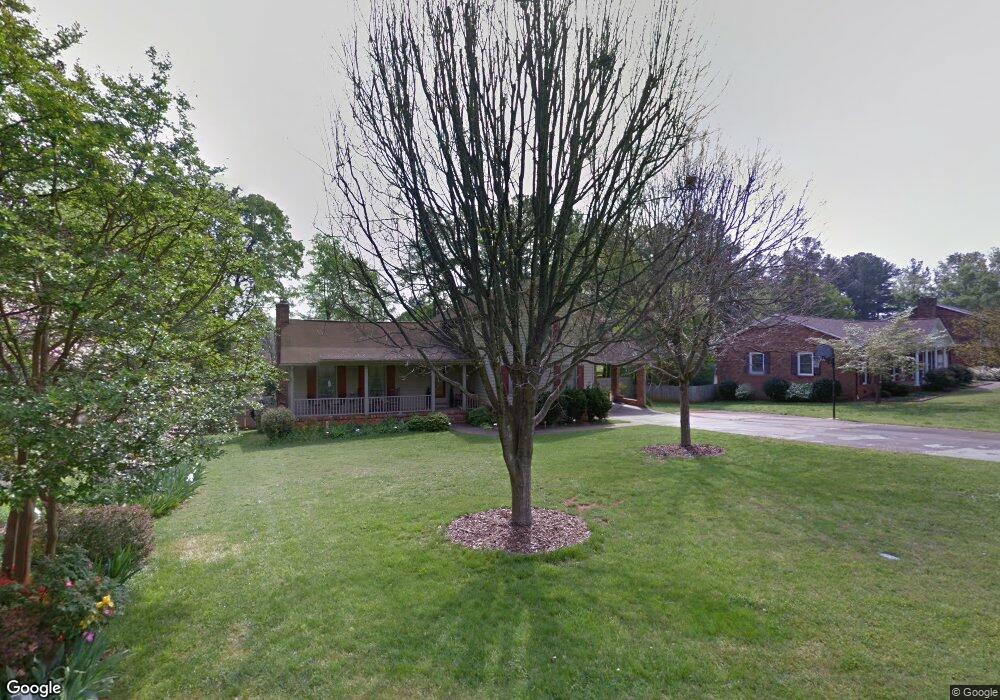
823 Elmwood Dr Shelby, NC 28152
Estimated Value: $248,170 - $332,000
--
Bed
--
Bath
2,079
Sq Ft
$140/Sq Ft
Est. Value
About This Home
This home is located at 823 Elmwood Dr, Shelby, NC 28152 and is currently estimated at $291,793, approximately $140 per square foot. 823 Elmwood Dr is a home located in Cleveland County with nearby schools including Graham Elementary School, James Love Elementary School, and Shelby Middle School.
Ownership History
Date
Name
Owned For
Owner Type
Purchase Details
Closed on
Sep 11, 2012
Sold by
Martin Stanley R and Martin Sherryl J
Bought by
Martin Stanley R
Current Estimated Value
Home Financials for this Owner
Home Financials are based on the most recent Mortgage that was taken out on this home.
Original Mortgage
$50,000
Interest Rate
3.63%
Mortgage Type
New Conventional
Create a Home Valuation Report for This Property
The Home Valuation Report is an in-depth analysis detailing your home's value as well as a comparison with similar homes in the area
Home Values in the Area
Average Home Value in this Area
Purchase History
| Date | Buyer | Sale Price | Title Company |
|---|---|---|---|
| Martin Stanley R | -- | None Available |
Source: Public Records
Mortgage History
| Date | Status | Borrower | Loan Amount |
|---|---|---|---|
| Closed | Martin Stanley R | $50,000 |
Source: Public Records
Tax History Compared to Growth
Tax History
| Year | Tax Paid | Tax Assessment Tax Assessment Total Assessment is a certain percentage of the fair market value that is determined by local assessors to be the total taxable value of land and additions on the property. | Land | Improvement |
|---|---|---|---|---|
| 2025 | $2,260 | $227,159 | $18,312 | $208,847 |
| 2024 | $2,166 | $177,653 | $13,672 | $163,981 |
| 2023 | $2,155 | $177,653 | $13,672 | $163,981 |
| 2022 | $2,155 | $177,653 | $13,672 | $163,981 |
| 2021 | $2,166 | $177,653 | $13,672 | $163,981 |
| 2020 | $1,897 | $150,926 | $13,672 | $137,254 |
| 2019 | $1,897 | $150,926 | $13,672 | $137,254 |
| 2018 | $1,896 | $150,926 | $13,672 | $137,254 |
| 2017 | $1,849 | $150,926 | $13,672 | $137,254 |
| 2016 | $1,856 | $150,926 | $13,672 | $137,254 |
| 2015 | $1,949 | $167,170 | $13,672 | $153,498 |
| 2014 | $1,949 | $167,170 | $13,672 | $153,498 |
Source: Public Records
Map
Nearby Homes