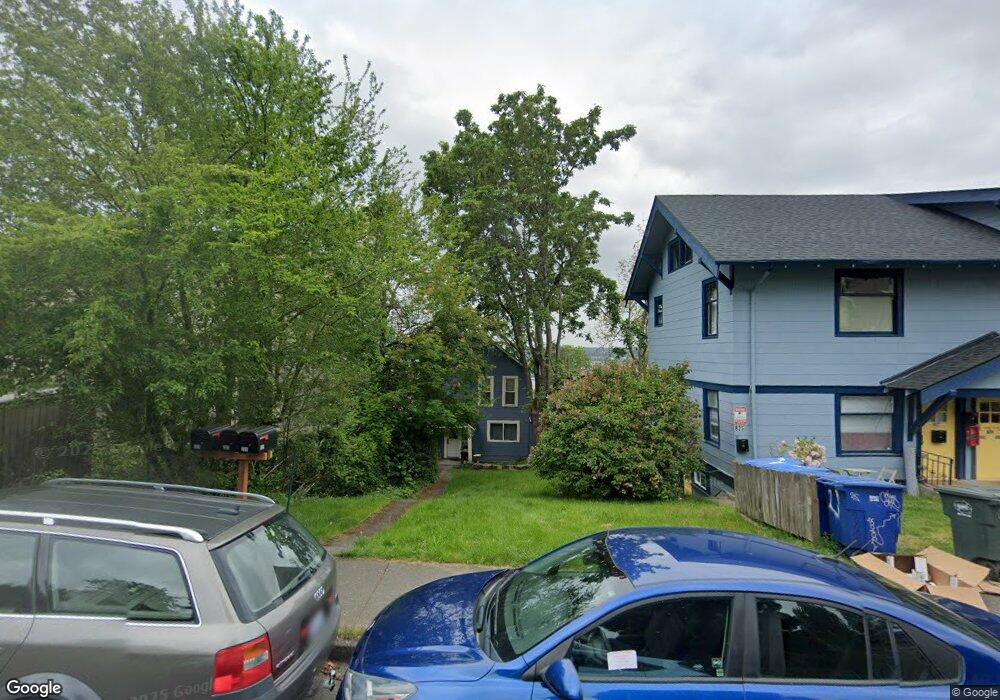
823 High St Bellingham, WA 98225
Sehome NeighborhoodEstimated Value: $697,000 - $764,000
3
Beds
1
Bath
950
Sq Ft
$774/Sq Ft
Est. Value
About This Home
This home is located at 823 High St, Bellingham, WA 98225 and is currently estimated at $734,941, approximately $773 per square foot. 823 High St is a home located in Whatcom County with nearby schools including Lowell Elementary School, Fairhaven Middle School, and Sehome High School.
Ownership History
Date
Name
Owned For
Owner Type
Purchase Details
Closed on
Jan 3, 2012
Sold by
Hansen Ginny
Bought by
Hansen Jonathan D
Current Estimated Value
Home Financials for this Owner
Home Financials are based on the most recent Mortgage that was taken out on this home.
Original Mortgage
$164,500
Outstanding Balance
$110,834
Interest Rate
3.85%
Mortgage Type
New Conventional
Estimated Equity
$624,107
Purchase Details
Closed on
Jun 30, 2007
Sold by
Merrill Geri Beth
Bought by
High Street Duplex Llc
Purchase Details
Closed on
Jun 6, 2005
Sold by
Merrill Peter
Bought by
Merrill Geri Beth
Home Financials for this Owner
Home Financials are based on the most recent Mortgage that was taken out on this home.
Original Mortgage
$252,800
Interest Rate
6.87%
Mortgage Type
Fannie Mae Freddie Mac
Create a Home Valuation Report for This Property
The Home Valuation Report is an in-depth analysis detailing your home's value as well as a comparison with similar homes in the area
Home Values in the Area
Average Home Value in this Area
Purchase History
| Date | Buyer | Sale Price | Title Company |
|---|---|---|---|
| Hansen Jonathan D | $238,807 | Whatcom Land Title Co Inc | |
| Hansen Jonathan D | $220,280 | Whatcom Land Title Co Inc | |
| High Street Duplex Llc | -- | None Available | |
| Merrill Geri Beth | -- | Whatcom Land Title | |
| Merrill Geri Beth | $316,000 | Whatcom Land Title |
Source: Public Records
Mortgage History
| Date | Status | Borrower | Loan Amount |
|---|---|---|---|
| Open | Hansen Jonathan D | $164,500 | |
| Previous Owner | Merrill Geri Beth | $252,800 | |
| Closed | Merrill Geri Beth | $31,600 |
Source: Public Records
Tax History
| Year | Tax Paid | Tax Assessment Tax Assessment Total Assessment is a certain percentage of the fair market value that is determined by local assessors to be the total taxable value of land and additions on the property. | Land | Improvement |
|---|---|---|---|---|
| 2025 | $5,566 | $700,347 | $491,520 | $208,827 |
| 2024 | $5,426 | $679,957 | $477,210 | $202,747 |
| 2023 | $5,426 | $697,269 | $489,360 | $207,909 |
| 2022 | $4,288 | $590,918 | $414,720 | $176,198 |
| 2021 | $4,207 | $461,655 | $324,000 | $137,655 |
| 2020 | $3,751 | $427,458 | $300,000 | $127,458 |
| 2019 | $3,534 | $368,402 | $244,200 | $124,202 |
| 2018 | $3,557 | $348,029 | $230,769 | $117,260 |
| 2017 | $3,097 | $299,501 | $198,330 | $101,171 |
| 2016 | $2,783 | $272,468 | $180,345 | $92,123 |
| 2015 | $2,790 | $254,918 | $170,115 | $84,803 |
| 2014 | -- | $247,253 | $165,000 | $82,253 |
| 2013 | -- | $237,547 | $159,300 | $78,247 |
Source: Public Records
Map
Nearby Homes
- 819 High St Unit 101
- 819 High St Unit 317
- 826 N Garden St
- 1305 N Forest St
- 715 N Garden St Unit 502
- 924 N Garden St Unit 201
- 901 N Forest St Unit 123
- 901 N Forest St Unit 109
- 820 N State St Unit 520
- 820 N State St Unit 505
- 820 N State St Unit 521
- 820 N State St Unit 513
- 310 E Ivy St
- 1028 Billy Frank Jr St Unit 301
- 1001 N State St Unit 209
- 800 E Maple St
- 1031 N State St Unit 107
- 1126 N Forest St
- 0 Pine St Unit NWM2445229
- 414 Boulevard Unit 105
- 514 E Myrtle St
- 819 High St
- 819 High St Unit 318
- 819 High St Unit 316
- 819 High St Unit 315
- 819 High St Unit 314
- 819 High St Unit 313
- 819 High St Unit 211
- 819 High St Unit 210
- 819 High St Unit 209
- 819 High St Unit 208
- 819 High St Unit 207
- 819 High St Unit 106
- 819 High St Unit 105
- 819 High St Unit 104
- 819 High St Unit 103
- 819 High St
- 819 High St #208
- 510 E Myrtle St
Your Personal Tour Guide
Ask me questions while you tour the home.