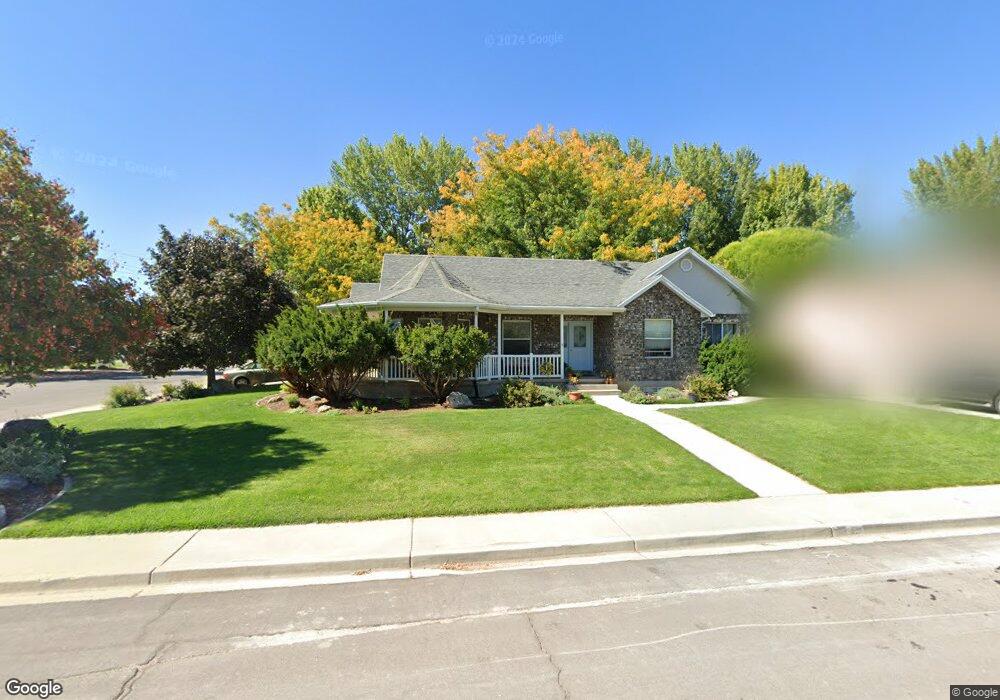
823 N 1140 W Mapleton, UT 84664
Estimated Value: $653,000 - $766,000
6
Beds
4
Baths
4,200
Sq Ft
$165/Sq Ft
Est. Value
About This Home
This home is located at 823 N 1140 W, Mapleton, UT 84664 and is currently estimated at $694,948, approximately $165 per square foot. 823 N 1140 W is a home located in Utah County with nearby schools including Mapleton School, Mapleton Junior High School, and Maple Mountain High School.
Ownership History
Date
Name
Owned For
Owner Type
Purchase Details
Closed on
Dec 26, 2006
Sold by
Roylance Jeffrey B and Roylance Jennette L
Bought by
Roylance Jennette L
Current Estimated Value
Purchase Details
Closed on
Feb 17, 2005
Sold by
Norton Gary L and Norton Andrea
Bought by
Roylance Jeffrey B and Roylance Jennette L
Purchase Details
Closed on
Apr 9, 1999
Sold by
Norton Gary and Norton Andrea
Bought by
Norton Gary L and Norton Andrea
Home Financials for this Owner
Home Financials are based on the most recent Mortgage that was taken out on this home.
Original Mortgage
$191,000
Interest Rate
7.04%
Purchase Details
Closed on
Dec 17, 1998
Sold by
Mangelson Karen
Bought by
Norton Gary and Norton Andrea
Home Financials for this Owner
Home Financials are based on the most recent Mortgage that was taken out on this home.
Original Mortgage
$209,800
Interest Rate
6.86%
Purchase Details
Closed on
Nov 1, 1996
Sold by
Smith Don M and Smith Linda K
Bought by
Mangelson Karen
Home Financials for this Owner
Home Financials are based on the most recent Mortgage that was taken out on this home.
Original Mortgage
$90,000
Interest Rate
8.06%
Create a Home Valuation Report for This Property
The Home Valuation Report is an in-depth analysis detailing your home's value as well as a comparison with similar homes in the area
Home Values in the Area
Average Home Value in this Area
Purchase History
| Date | Buyer | Sale Price | Title Company |
|---|---|---|---|
| Roylance Jennette L | -- | None Available | |
| Roylance Jeffrey B | -- | Affiliated First Title Comp | |
| Norton Gary L | -- | Pro Title & Escrow Inc | |
| Norton Gary | -- | Old Republic Title Company | |
| Mangelson Karen | -- | Provo Land Title |
Source: Public Records
Mortgage History
| Date | Status | Borrower | Loan Amount |
|---|---|---|---|
| Previous Owner | Norton Gary L | $191,000 | |
| Previous Owner | Norton Gary | $209,800 | |
| Previous Owner | Mangelson Karen | $90,000 |
Source: Public Records
Tax History
| Year | Tax Paid | Tax Assessment Tax Assessment Total Assessment is a certain percentage of the fair market value that is determined by local assessors to be the total taxable value of land and additions on the property. | Land | Improvement |
|---|---|---|---|---|
| 2025 | $3,081 | $334,565 | -- | -- |
| 2024 | $3,081 | $301,785 | $0 | $0 |
| 2023 | $3,176 | $313,060 | $0 | $0 |
| 2022 | $3,535 | $344,575 | $0 | $0 |
| 2021 | $2,970 | $444,500 | $162,000 | $282,500 |
| 2020 | $2,942 | $425,900 | $143,400 | $282,500 |
| 2019 | $2,669 | $394,300 | $137,600 | $256,700 |
| 2018 | $2,509 | $352,900 | $115,900 | $237,000 |
| 2017 | $2,352 | $175,560 | $0 | $0 |
| 2016 | $2,312 | $171,600 | $0 | $0 |
| 2015 | $2,245 | $165,605 | $0 | $0 |
| 2014 | $2,101 | $152,185 | $0 | $0 |
Source: Public Records
Map
Nearby Homes
- 1446 W 600 N Unit 5
- 1512 W 600 N Unit 4
- 405 W 1200 N Unit 4
- 487 W 1200 N Unit 1
- 1410 W 1200 N
- 1631 W Century Ln Unit B
- 1142 W 220 N
- 1272 W 220 N
- 754 W 400 N Unit 29
- 667 N 550 W
- 572 W 500 N
- 648 W 400 N
- 1836 W 800 N
- 581 N Heritage St Unit 5
- 599 N Heritage St Unit 6
- 641 N Heritage St Unit 8
- 1222 W 190 N
- 657 N Heritage St Unit 9
- 683 N Heritage St
- 1896 W 800 N
Your Personal Tour Guide
Ask me questions while you tour the home.