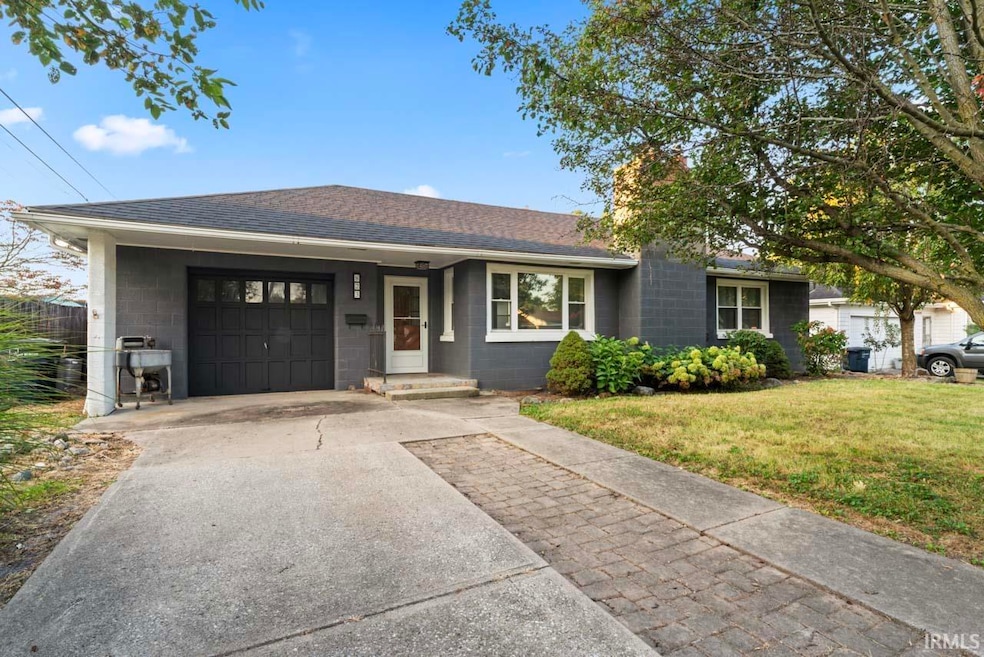
823 N A St Elwood, IN 46036
Estimated payment $911/month
Highlights
- Traditional Architecture
- 1-Story Property
- Baseboard Heating
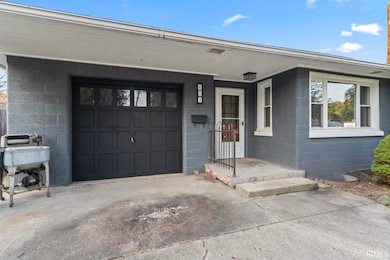
- 1 Car Attached Garage
About This Home
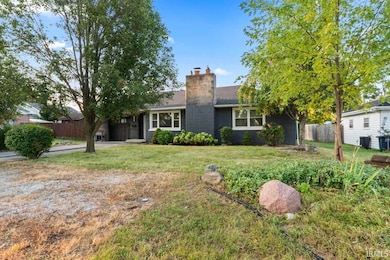
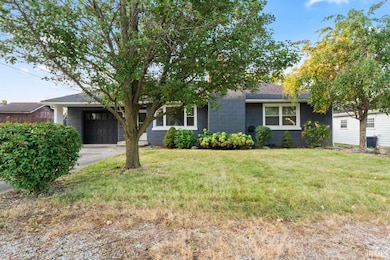
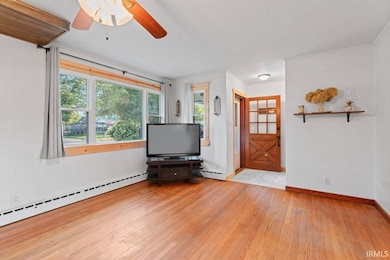
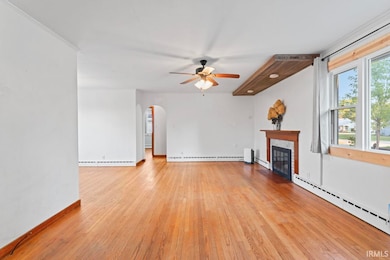
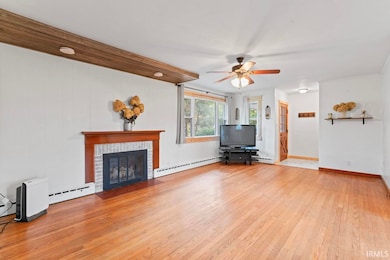
Discover the charm of 823 N A ST, Elwood, IN. Offering 1262 square feet of living area, the layout includes three bedrooms and full bathroom. The residence also includes a half bathroom. Resting on a 5720 square foot lot, the property presents outdoor possibilities, allowing you to cultivate a garden or create an inviting patio. This Elwood residence is a wonderful opportunity to craft a comfortable home.
Home Details
Home Type
- Single Family
Est. Annual Taxes
- $479
Year Built
- Built in 1950
Lot Details
- 5,720 Sq Ft Lot
- Lot Dimensions are 44x130
Parking
- 1 Car Attached Garage
Home Design
- Traditional Architecture
- Poured Concrete
- Block Exterior
Interior Spaces
- 1-Story Property
- Unfinished Basement
- Basement Fills Entire Space Under The House
Bedrooms and Bathrooms
- 3 Bedrooms
Schools
- Elwood Elementary And Middle School
- Elwood High School
Utilities
- Window Unit Cooling System
- Baseboard Heating
Listing and Financial Details
- Assessor Parcel Number 48-04-09-403-181.000-027
Map
Home Values in the Area
Average Home Value in this Area
Tax History
| Year | Tax Paid | Tax Assessment Tax Assessment Total Assessment is a certain percentage of the fair market value that is determined by local assessors to be the total taxable value of land and additions on the property. | Land | Improvement |
|---|---|---|---|---|
| 2024 | $463 | $46,300 | $9,700 | $36,600 |
| 2023 | $431 | $42,500 | $9,300 | $33,200 |
| 2022 | $383 | $42,000 | $8,800 | $33,200 |
| 2021 | $349 | $39,200 | $8,800 | $30,400 |
| 2020 | $361 | $39,000 | $8,300 | $30,700 |
| 2019 | $363 | $38,100 | $8,300 | $29,800 |
| 2018 | $330 | $35,800 | $8,300 | $27,500 |
| 2017 | $310 | $104,000 | $8,300 | $95,700 |
| 2016 | $1,039 | $102,700 | $8,300 | $94,400 |
| 2014 | $1,011 | $100,900 | $8,300 | $92,600 |
| 2013 | $1,011 | $100,900 | $8,300 | $92,600 |
Property History
| Date | Event | Price | List to Sale | Price per Sq Ft |
|---|---|---|---|---|
| 11/21/2025 11/21/25 | Price Changed | $164,900 | -5.7% | $131 / Sq Ft |
| 10/28/2025 10/28/25 | Price Changed | $174,900 | -5.4% | $139 / Sq Ft |
| 09/12/2025 09/12/25 | For Sale | $184,900 | -- | $147 / Sq Ft |
Purchase History
| Date | Type | Sale Price | Title Company |
|---|---|---|---|
| Warranty Deed | $33,900 | -- | |
| Sheriffs Deed | $44,020 | -- | |
| Warranty Deed | -- | -- |
Mortgage History
| Date | Status | Loan Amount | Loan Type |
|---|---|---|---|
| Previous Owner | $72,900 | New Conventional |
Source: Indiana Regional MLS
MLS Number: 202537020
APN: 48-04-09-403-181.000-027
Disclaimer: Certain information contained herein is derived from information provided by parties other than Homes.com. All information provided is deemed reliable, but is not guaranteed to be accurate and should be independently verified.
![]() IDX information is provided exclusively for personal, non-commercial use, and may not be used for any purpose other than to identify prospective properties consumers may be interested in purchasing. Information is deemed reliable but not guaranteed.
IDX information is provided exclusively for personal, non-commercial use, and may not be used for any purpose other than to identify prospective properties consumers may be interested in purchasing. Information is deemed reliable but not guaranteed.
- 1522 Main St Unit 3
- 1017 N 9th St
- 1019 N 9th St
- 1021 N 9th St
- 1023 N 9th St
- 1025 N 9th St
- 1027 N 9th St
- 1014 N 10th St
- 1016 N 10th St
- 1018 N 10th St
- 1020 N 10th St
- 1022 N 10th St
- 1024 N 10th St
- 1026 N 10th St
- 1028 N 10th St
- 209 S 16th St
- 312 S 18th St Unit 303
- 9401 Frans Way
- 411 N Sheridan St Unit .5
- 605 W Jefferson St
