Estimated Value: $365,638 - $392,000
3
Beds
3
Baths
2,806
Sq Ft
$135/Sq Ft
Est. Value
About This Home
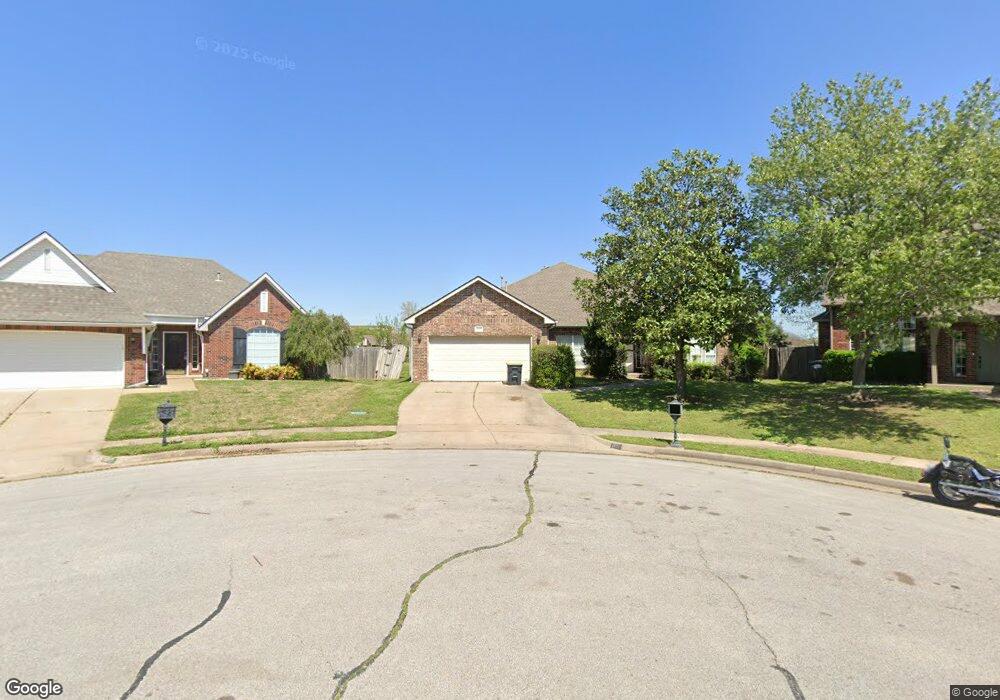
This home is located at 823 N Douglas St, Jenks, OK 74037 and is currently estimated at $377,910, approximately $134 per square foot. 823 N Douglas St is a home located in Tulsa County with nearby schools including Jenks West Elementary School, Jenks West Intermediate Elementary School, and Jenks Middle School.
Ownership History
Date
Name
Owned For
Owner Type
Purchase Details
Closed on
Oct 16, 2001
Sold by
Prudential Residential Svcs Ltd Prtnrshp
Bought by
Dolan Kevin P and Dolan Jennifer L
Current Estimated Value
Home Financials for this Owner
Home Financials are based on the most recent Mortgage that was taken out on this home.
Original Mortgage
$155,200
Interest Rate
6.73%
Mortgage Type
Purchase Money Mortgage
Purchase Details
Closed on
Oct 15, 2001
Sold by
Ladd Mark and Ladd Linda S
Bought by
Prudential Residential Svcs Ltd Prtnrshp
Home Financials for this Owner
Home Financials are based on the most recent Mortgage that was taken out on this home.
Original Mortgage
$155,200
Interest Rate
6.73%
Mortgage Type
Purchase Money Mortgage
Purchase Details
Closed on
Aug 7, 1998
Sold by
Sweetin Jody L and Sweetin Deborah A
Bought by
Ladd Mark and Ladd Linda S
Purchase Details
Closed on
Mar 1, 1997
Create a Home Valuation Report for This Property
The Home Valuation Report is an in-depth analysis detailing your home's value as well as a comparison with similar homes in the area
Home Values in the Area
Average Home Value in this Area
Purchase History
| Date | Buyer | Sale Price | Title Company |
|---|---|---|---|
| Dolan Kevin P | $194,000 | Firstitle & Abstract Svcs In | |
| Prudential Residential Svcs Ltd Prtnrshp | $194,000 | Firstitle & Abstract Svcs In | |
| Ladd Mark | $174,500 | First Amer Title & Abstract | |
| -- | $27,500 | -- |
Source: Public Records
Mortgage History
| Date | Status | Borrower | Loan Amount |
|---|---|---|---|
| Previous Owner | Dolan Kevin P | $155,200 |
Source: Public Records
Tax History Compared to Growth
Tax History
| Year | Tax Paid | Tax Assessment Tax Assessment Total Assessment is a certain percentage of the fair market value that is determined by local assessors to be the total taxable value of land and additions on the property. | Land | Improvement |
|---|---|---|---|---|
| 2024 | $3,242 | $26,254 | $2,679 | $23,575 |
| 2023 | $3,242 | $26,460 | $2,532 | $23,928 |
| 2022 | $3,174 | $24,690 | $3,301 | $21,389 |
| 2021 | $3,118 | $23,941 | $3,201 | $20,740 |
| 2020 | $2,956 | $23,215 | $3,104 | $20,111 |
| 2019 | $2,886 | $22,510 | $3,010 | $19,500 |
| 2018 | $2,817 | $21,825 | $3,397 | $18,428 |
| 2017 | $2,771 | $22,825 | $3,553 | $19,272 |
| 2016 | $2,839 | $22,825 | $3,553 | $19,272 |
| 2015 | $2,857 | $22,825 | $3,553 | $19,272 |
| 2014 | $2,832 | $21,890 | $3,553 | $18,337 |
Source: Public Records
Map
Nearby Homes
- 1410 W 91st St
- 2040 E 129th Place S
- 508 N Willow St
- 8732 S Quanah Ave
- 8730 S Olympia Ave
- 2428 W C St
- 2105 W F Ct
- 908 W 86th Place S
- 1107 W 86th Place S
- 8723 S Phoenix Place W
- 2102 W J St
- 1118 W 86th St S
- 1114 W 86th St S
- 922 W 86th St S
- 1105 W 86th St S
- 1228 W 85th Ct S
- 1114 W 85th Place S
- 9726 S Houston Ave
- 912 W 85th St
- 8505 S Phoenix Ave