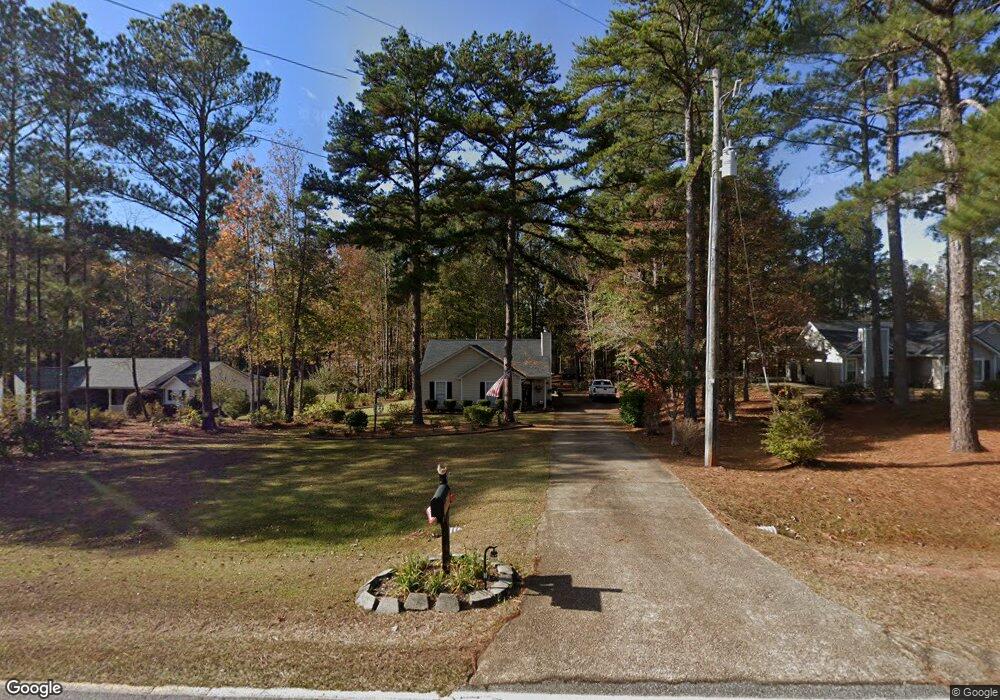
823 Priddy Rd Lagrange, GA 30241
Estimated Value: $205,485 - $276,000
3
Beds
2
Baths
1,201
Sq Ft
$193/Sq Ft
Est. Value
About This Home
This home is located at 823 Priddy Rd, Lagrange, GA 30241 and is currently estimated at $231,371, approximately $192 per square foot. 823 Priddy Rd is a home located in Troup County with nearby schools including Rosemont Elementary School, Whitesville Road Elementary School, and Berta Weathersbee Elementary School.
Ownership History
Date
Name
Owned For
Owner Type
Purchase Details
Closed on
Oct 17, 2016
Sold by
Estes Steven B
Bought by
Estes Steve D and Estes Mary Jane
Current Estimated Value
Home Financials for this Owner
Home Financials are based on the most recent Mortgage that was taken out on this home.
Original Mortgage
$114,000
Outstanding Balance
$90,771
Interest Rate
3.5%
Mortgage Type
New Conventional
Estimated Equity
$140,600
Purchase Details
Closed on
May 20, 2004
Sold by
Scott J Mcquire
Bought by
Estes Steven B
Purchase Details
Closed on
May 31, 2002
Sold by
Connie D Davis
Bought by
Scott J Mcquire
Purchase Details
Closed on
Dec 7, 1998
Sold by
Upchurch Joel
Bought by
Connie D Davis
Purchase Details
Closed on
Jan 31, 1997
Sold by
Robert T Upchurch
Bought by
Upchurch Joel
Purchase Details
Closed on
Dec 19, 1995
Sold by
Barbara C Hathway
Bought by
Robert T Upchurch
Create a Home Valuation Report for This Property
The Home Valuation Report is an in-depth analysis detailing your home's value as well as a comparison with similar homes in the area
Purchase History
| Date | Buyer | Sale Price | Title Company |
|---|---|---|---|
| Estes Steve D | $120,000 | -- | |
| Estes Steven B | $108,800 | -- | |
| Scott J Mcquire | $92,900 | -- | |
| Connie D Davis | $77,900 | -- | |
| Upchurch Joel | -- | -- | |
| Robert T Upchurch | -- | -- |
Source: Public Records
Mortgage History
| Date | Status | Borrower | Loan Amount |
|---|---|---|---|
| Open | Estes Steve D | $114,000 |
Source: Public Records
Tax History
| Year | Tax Paid | Tax Assessment Tax Assessment Total Assessment is a certain percentage of the fair market value that is determined by local assessors to be the total taxable value of land and additions on the property. | Land | Improvement |
|---|---|---|---|---|
| 2025 | $970 | $65,832 | $5,840 | $59,992 |
| 2024 | $805 | $56,400 | $5,840 | $50,560 |
| 2023 | $536 | $46,564 | $5,840 | $40,724 |
| 2022 | $461 | $42,884 | $5,840 | $37,044 |
| 2021 | $1,223 | $40,540 | $5,160 | $35,380 |
| 2020 | $1,223 | $40,540 | $5,160 | $35,380 |
| 2019 | $1,217 | $40,348 | $5,160 | $35,188 |
| 2018 | $1,121 | $37,156 | $5,160 | $31,996 |
| 2017 | $1,121 | $37,156 | $5,160 | $31,996 |
| 2016 | $868 | $28,792 | $4,400 | $24,392 |
| 2015 | $870 | $28,792 | $4,400 | $24,392 |
| 2014 | $832 | $27,508 | $4,400 | $23,108 |
| 2013 | -- | $28,463 | $4,400 | $24,063 |
Source: Public Records
Map
Nearby Homes
- 246 S Smith Rd
- 113 Glenn Eagle Point
- 137 Robertson Rd
- 130 Hamilton Lake Dr
- 11.59+/- AC Hunt Rd
- 0 Briley Rd Unit 10582531
- 0 Briley Rd Unit 214353
- 1820 Salem Rd
- 0 Robert Hodnett Rd Unit 10709308
- 0 Salem Lot 3 Rd Unit LOT 3
- 0 Salem Lot 1 Rd Unit LOT 1
- 5656 Hamilton Rd
- 5656 Hamilton Rd
- 2851 & 2891 Hamilton Rd
- 0 Smokey Rd Unit 10570471
- 950 John Lovelace Rd
- 3913 Whitesville Rd
- 830 John Lovelace Rd
- 417 Tucker Rd
- 264 S Glenn Rd
- 813 Priddy Rd
- 835 Priddy Rd
- 847 Priddy Rd
- 807 Priddy Rd
- 856 Priddy Rd
- 796 Priddy Rd
- 0 Priddy Rd & S Smith Unit TR 1 A 8683066
- 773 Priddy Rd
- 25 S Smith Rd
- 875 Priddy Rd
- 747 Priddy Rd
- 35 S Smith Rd
- 35 South Smith Rd
- 45 South Smith Rd
- 45 South Smith Rd
- 46 South Smith Rd
- 913 Priddy Rd
- 55 South Smith Rd
- 110 Prestwick Dr
- 66 S Smith Rd
Your Personal Tour Guide
Ask me questions while you tour the home.