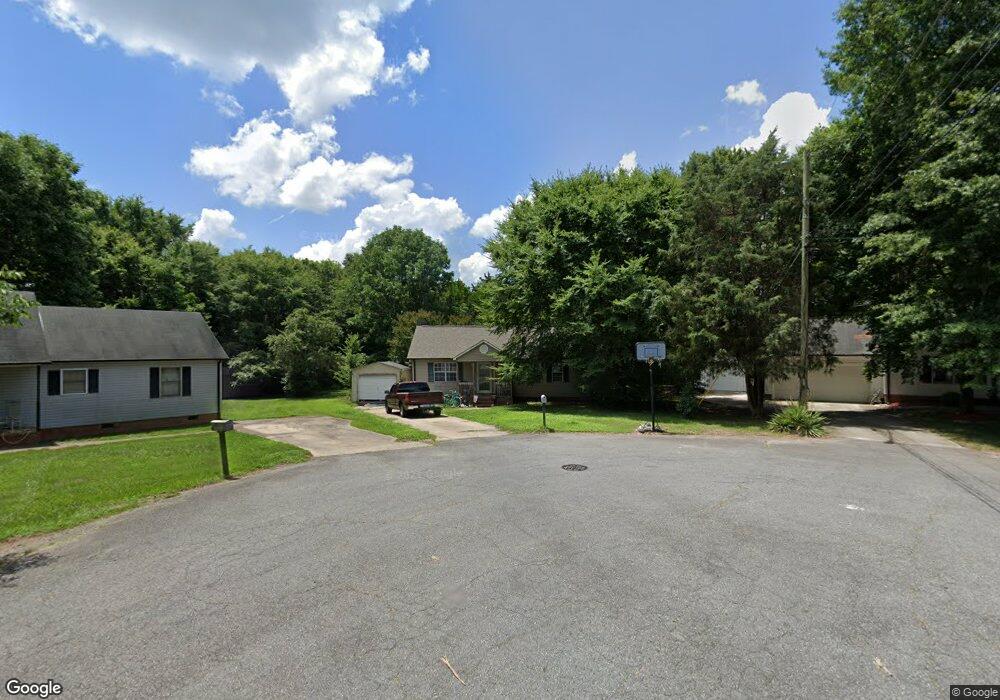
823 Primrose Ln NW Concord, NC 28027
Estimated Value: $197,000 - $265,000
3
Beds
2
Baths
1,056
Sq Ft
$222/Sq Ft
Est. Value
About This Home
This home is located at 823 Primrose Ln NW, Concord, NC 28027 and is currently estimated at $234,382, approximately $221 per square foot. 823 Primrose Ln NW is a home located in Cabarrus County with nearby schools including Weddington Hills Elementary School, Harold E. Winkler Middle School, and Cabarrus Charter Academy.
Ownership History
Date
Name
Owned For
Owner Type
Purchase Details
Closed on
Nov 5, 2012
Sold by
Us Bank Na
Bought by
Sullivan Brian and Sullivan Elyse
Current Estimated Value
Home Financials for this Owner
Home Financials are based on the most recent Mortgage that was taken out on this home.
Original Mortgage
$54,000
Outstanding Balance
$37,333
Interest Rate
3.4%
Mortgage Type
New Conventional
Estimated Equity
$197,049
Purchase Details
Closed on
Aug 6, 2012
Sold by
Parrish Deborah K and Parrish David Thomas
Bought by
Us Bank National Assn
Purchase Details
Closed on
Feb 23, 1999
Sold by
Cantrell Phillip R and Cantrell Rebecca B
Bought by
Whitaker Deborah K
Home Financials for this Owner
Home Financials are based on the most recent Mortgage that was taken out on this home.
Original Mortgage
$81,681
Interest Rate
6.84%
Purchase Details
Closed on
Aug 1, 1993
Create a Home Valuation Report for This Property
The Home Valuation Report is an in-depth analysis detailing your home's value as well as a comparison with similar homes in the area
Home Values in the Area
Average Home Value in this Area
Purchase History
| Date | Buyer | Sale Price | Title Company |
|---|---|---|---|
| Sullivan Brian | $72,000 | None Available | |
| Us Bank National Assn | $56,700 | None Available | |
| Whitaker Deborah K | $90,000 | -- | |
| -- | $67,000 | -- |
Source: Public Records
Mortgage History
| Date | Status | Borrower | Loan Amount |
|---|---|---|---|
| Open | Sullivan Brian | $54,000 | |
| Previous Owner | Whitaker Deborah K | $81,681 |
Source: Public Records
Tax History Compared to Growth
Tax History
| Year | Tax Paid | Tax Assessment Tax Assessment Total Assessment is a certain percentage of the fair market value that is determined by local assessors to be the total taxable value of land and additions on the property. | Land | Improvement |
|---|---|---|---|---|
| 2025 | $2,161 | $216,940 | $45,000 | $171,940 |
| 2024 | $2,161 | $216,940 | $45,000 | $171,940 |
| 2023 | $1,645 | $134,830 | $38,000 | $96,830 |
| 2022 | $1,645 | $134,830 | $38,000 | $96,830 |
| 2021 | $1,645 | $134,830 | $38,000 | $96,830 |
| 2020 | $1,645 | $134,830 | $38,000 | $96,830 |
| 2019 | $1,183 | $96,940 | $22,000 | $74,940 |
| 2018 | $1,163 | $96,940 | $22,000 | $74,940 |
| 2017 | $1,144 | $96,940 | $22,000 | $74,940 |
| 2016 | $679 | $96,230 | $22,000 | $74,230 |
| 2015 | $1,136 | $96,230 | $22,000 | $74,230 |
| 2014 | $1,136 | $96,230 | $22,000 | $74,230 |
Source: Public Records
Map
Nearby Homes
- 3724 Patricia Dr NW
- 3793 Lake Spring Ave NW
- 1252 Giverny Ct NW
- 3575 Travis Ln NW
- 1246 Greenside Dr NW
- 234 Candle Ct NW
- 2635 Danbury Circle Dr NW
- 2652 Bedford Place NW
- 2676 Sunberry Ln NW
- 458 Allen Dr NW
- 456 Allen Dr NW
- 490 Cavehill Dr NW
- 533 Montgrove Place NW
- 518 Wellbourne Ct NW
- 542 Buffinton Ct NW
- 2695 Jameson Dr NW
- 2567 Roswell Ct NW
- 578 Ambergate Place NW
- 4654 Habersham Ct NW
- 664 Summerford Ct NW
- 819 Primrose Ln NW
- 3758 Fieldcrest Cir NW
- 1068 Iveywood Place NW
- 1065 Iveywood Place NW
- 1070 Iveywood Place NW
- 3939 Saint Andrews Cir NW
- 815 Primrose Ln NW
- 3754 Fieldcrest Cir NW
- 3940 Saint Andrews Cir NW
- 1072 Iveywood Place NW
- 1064 Iveywood Place NW
- 3755 Fieldcrest Cir NW
- 811 Primrose Ln NW
- 3935 Saint Andrews Cir NW
- 3750 Fieldcrest Cir NW
- 1069 Iveywood Place NW
- 1074 Iveywood Place NW
- 1073 Iveywood Place NW
- 810 Primrose Ln NW
- 3936 Saint Andrews Cir NW