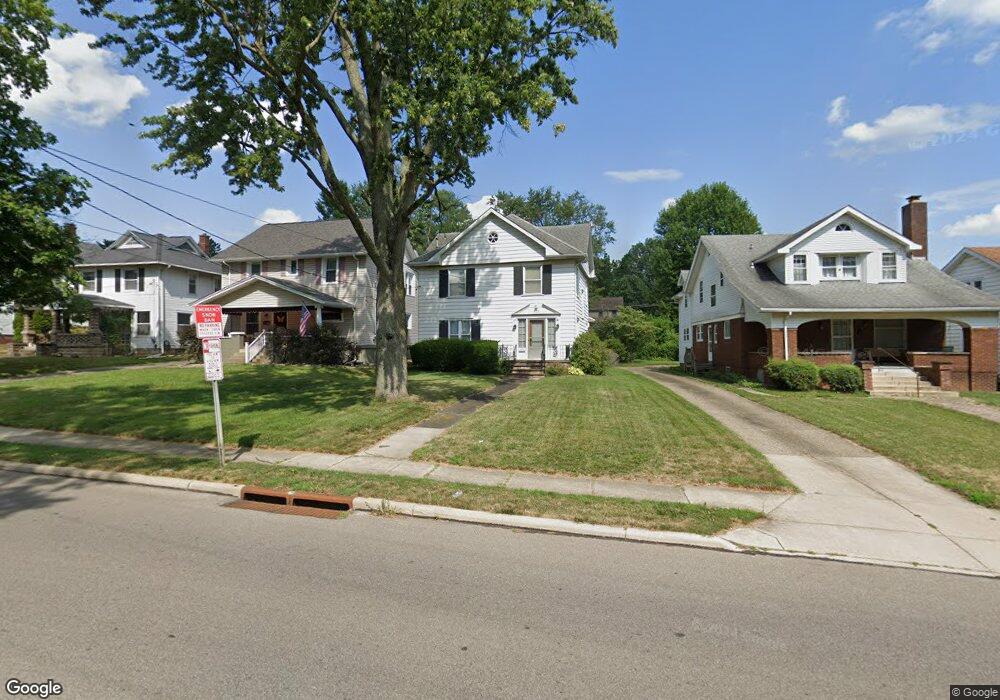
823 Quinby Ave Wooster, OH 44691
Estimated Value: $185,000 - $240,000
4
Beds
2
Baths
1,638
Sq Ft
$127/Sq Ft
Est. Value
About This Home
This home is located at 823 Quinby Ave, Wooster, OH 44691 and is currently estimated at $207,229, approximately $126 per square foot. 823 Quinby Ave is a home located in Wayne County with nearby schools including Cornerstone Elementary School, Edgewood Middle School, and Wooster High School.
Ownership History
Date
Name
Owned For
Owner Type
Purchase Details
Closed on
Jan 18, 2008
Sold by
Gunn Charles Douglas and Gunn Virginia L
Bought by
Gunn Virginia L and Virginia L Gunn Revocable Trust
Current Estimated Value
Purchase Details
Closed on
Jun 2, 2003
Sold by
Jacob Judithe and Craig Charles
Bought by
Gunn Charles Douglas and Gunn Virginia L
Home Financials for this Owner
Home Financials are based on the most recent Mortgage that was taken out on this home.
Original Mortgage
$26,000
Interest Rate
7%
Mortgage Type
Unknown
Create a Home Valuation Report for This Property
The Home Valuation Report is an in-depth analysis detailing your home's value as well as a comparison with similar homes in the area
Home Values in the Area
Average Home Value in this Area
Purchase History
| Date | Buyer | Sale Price | Title Company |
|---|---|---|---|
| Gunn Virginia L | -- | Attorney | |
| Gunn Charles Douglas | $115,000 | Wayne County Title Agency |
Source: Public Records
Mortgage History
| Date | Status | Borrower | Loan Amount |
|---|---|---|---|
| Closed | Gunn Charles Douglas | $26,000 |
Source: Public Records
Tax History Compared to Growth
Tax History
| Year | Tax Paid | Tax Assessment Tax Assessment Total Assessment is a certain percentage of the fair market value that is determined by local assessors to be the total taxable value of land and additions on the property. | Land | Improvement |
|---|---|---|---|---|
| 2024 | $1,855 | $43,700 | $13,100 | $30,600 |
| 2023 | $1,855 | $43,700 | $13,100 | $30,600 |
| 2022 | $1,790 | $33,620 | $10,080 | $23,540 |
| 2021 | $1,845 | $33,620 | $10,080 | $23,540 |
| 2020 | $1,751 | $33,620 | $10,080 | $23,540 |
| 2019 | $1,847 | $33,990 | $10,130 | $23,860 |
| 2018 | $1,852 | $33,990 | $10,130 | $23,860 |
| 2017 | $1,842 | $33,990 | $10,130 | $23,860 |
| 2016 | $1,926 | $32,680 | $9,740 | $22,940 |
| 2015 | $1,898 | $32,680 | $9,740 | $22,940 |
| 2014 | $1,893 | $32,680 | $9,740 | $22,940 |
| 2013 | $2,073 | $35,260 | $10,480 | $24,780 |
Source: Public Records
Map
Nearby Homes
- 900 Quinby Ave
- 143 Park Ave
- 336 Spring St
- 657 N Bever St
- 1117 Quinby Ave
- 1123 Quinby Ave
- 534 N Buckeye St
- 329 E Bowman St
- 537 N Grant St
- 423 N Market St
- 548 Spring St
- 450 N Grant St
- 406 N Walnut St
- 733 Spink St
- 804 Belmont Ave
- 554 Nold Ave
- 323 N Grant St
- 412 Emerick St
- 227 N Walnut St
- 229 N Walnut St