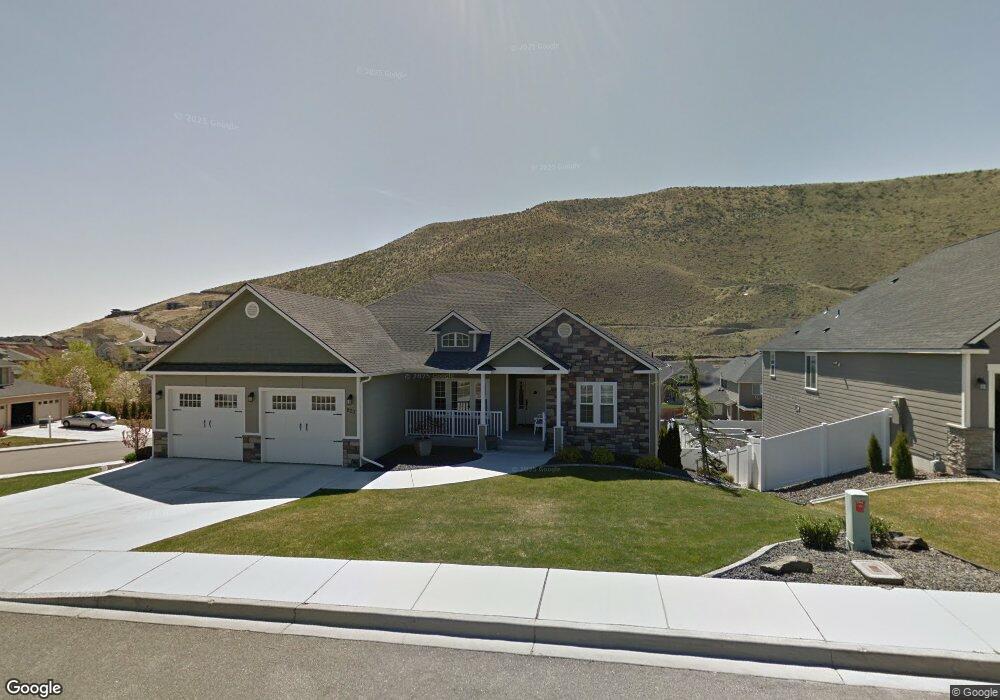
823 Rand Dr Unit Better Than New Richland, WA 99352
Estimated Value: $777,952 - $919,000
3
Beds
4
Baths
2,167
Sq Ft
$398/Sq Ft
Est. Value
About This Home
This home is located at 823 Rand Dr Unit Better Than New, Richland, WA 99352 and is currently estimated at $862,238, approximately $397 per square foot. 823 Rand Dr Unit Better Than New is a home located in Benton County with nearby schools including Orchard Elementary School, Enterprise Middle School, and Richland High School.
Ownership History
Date
Name
Owned For
Owner Type
Purchase Details
Closed on
Apr 22, 2016
Sold by
Lowery James R and Lowery Joyce M
Bought by
Swift Cornelius A and Swift Carrie S
Current Estimated Value
Purchase Details
Closed on
Mar 16, 2011
Sold by
Mahaffey Dustin T and Mahaffey Karen A
Bought by
Lowery James R and Lowery Joyce M
Home Financials for this Owner
Home Financials are based on the most recent Mortgage that was taken out on this home.
Original Mortgage
$351,000
Interest Rate
4.77%
Mortgage Type
New Conventional
Purchase Details
Closed on
Nov 18, 2005
Sold by
Bauder Milo B and Bauder Donna L
Bought by
Mahaffey Dustin T and Mahaffey Karen A
Create a Home Valuation Report for This Property
The Home Valuation Report is an in-depth analysis detailing your home's value as well as a comparison with similar homes in the area
Home Values in the Area
Average Home Value in this Area
Purchase History
| Date | Buyer | Sale Price | Title Company |
|---|---|---|---|
| Swift Cornelius A | $495,000 | Tri City Title & Escrow Llc | |
| Lowery James R | $390,000 | Chicago Title | |
| Mahaffey Dustin T | $42,000 | Cascade Title |
Source: Public Records
Mortgage History
| Date | Status | Borrower | Loan Amount |
|---|---|---|---|
| Previous Owner | Lowery James R | $351,000 |
Source: Public Records
Tax History Compared to Growth
Tax History
| Year | Tax Paid | Tax Assessment Tax Assessment Total Assessment is a certain percentage of the fair market value that is determined by local assessors to be the total taxable value of land and additions on the property. | Land | Improvement |
|---|---|---|---|---|
| 2024 | $6,574 | $755,870 | $110,000 | $645,870 |
| 2023 | $6,574 | $706,180 | $110,000 | $596,180 |
| 2022 | $4,858 | $466,390 | $65,000 | $401,390 |
| 2021 | $5,675 | $439,630 | $65,000 | $374,630 |
| 2020 | $6,001 | $493,140 | $65,000 | $428,140 |
| 2019 | $4,977 | $493,140 | $65,000 | $428,140 |
| 2018 | $4,866 | $439,630 | $65,000 | $374,630 |
| 2017 | $4,964 | $359,350 | $65,000 | $294,350 |
| 2016 | $4,895 | $414,800 | $54,000 | $360,800 |
| 2015 | $4,387 | $414,800 | $54,000 | $360,800 |
| 2014 | -- | $364,650 | $54,000 | $310,650 |
| 2013 | -- | $364,650 | $54,000 | $310,650 |
Source: Public Records
Map
Nearby Homes
- 996 Meadow Hills Dr
- 915 Meadow Hills Dr
- 2042 Morency Dr
- 2258 Morency Dr
- 2387 Morency Ct
- 2383 Morency Ct
- 483 Aimee Dr
- 2349 Morency Dr
- 2468 Maggio Loop
- 464 Agier Dr
- 2237 Legacy Ln
- 2420 Morency Dr
- 2150 Legacy Ln
- 341 Ventus St
- 1254 N Bermuda Rd
- 325 Falconridge St
- 1942 Sky Meadow Ave
- 316 Soaring Hawk St
- The Malone Plan at Westcliffe Heights
- The Bentley Plan at Westcliffe Heights
- 823 Rand Dr Unit BY APPT ONLY-4-Car w
- 823 Rand Dr Unit LIKE A MODEL HOME w/
- 823 Rand Dr Unit Gorgeous Craftsman C
- 823 Rand Dr
- 831 Rand Dr
- 870 Clermont Dr
- 888 Clermont Dr
- 839 Rand Dr
- 824 Rand Dr
- 818 Rand Dr
- 848 Clermont Dr
- 904 Clermont Dr
- 834 Rand Dr
- 1361 Gage Blvd
- 847 Rand Dr
- 842 Rand Dr
- 879 Clermont Dr Unit Crested Hills
- 879 Clermont Dr Unit Adjacent to Crested
- 879 Clermont Dr
- 2155 Morency Dr