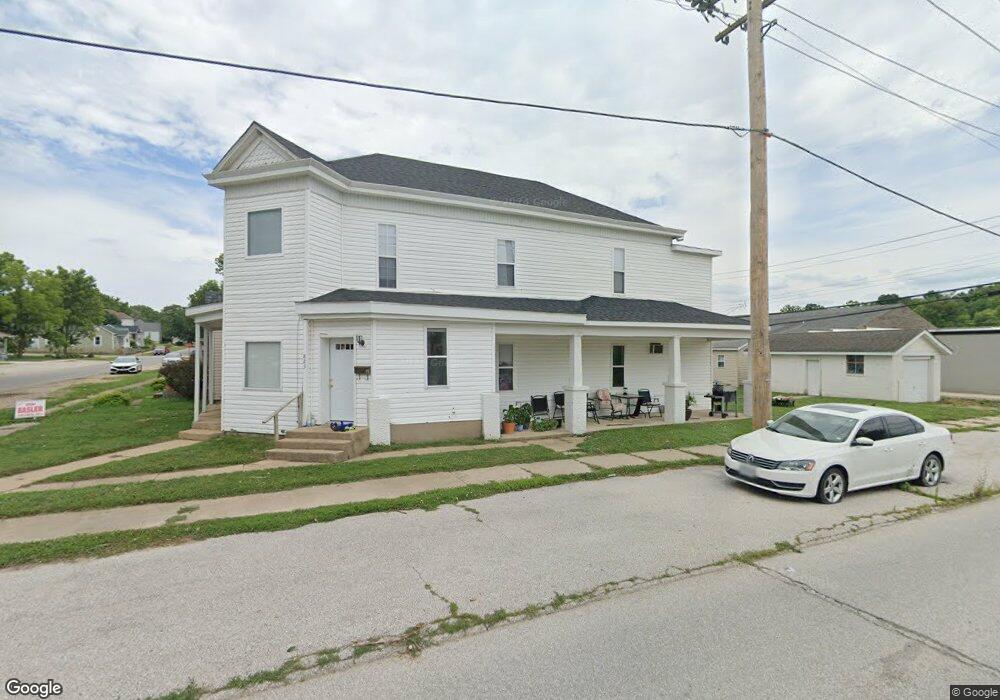
823 S 2nd St de Soto, MO 63020
Estimated Value: $120,045 - $194,000
--
Bed
--
Bath
2,491
Sq Ft
$67/Sq Ft
Est. Value
About This Home
This home is located at 823 S 2nd St, de Soto, MO 63020 and is currently estimated at $166,011, approximately $66 per square foot. 823 S 2nd St is a home located in Jefferson County with nearby schools including De Soto Senior High School and St Rose Of Lima School.
Ownership History
Date
Name
Owned For
Owner Type
Purchase Details
Closed on
Jan 6, 2012
Sold by
Deutsche Bank National Trust Company
Bought by
P & M Belken Properties Llc
Current Estimated Value
Purchase Details
Closed on
Jun 20, 2011
Sold by
Cain Edward J and Cain Jennifer L
Bought by
Deutsche Bank National Trust Company
Purchase Details
Closed on
Sep 27, 2005
Sold by
Cain Edward J and Cain Jennifer L
Bought by
Cain Edward J and Cain Jennifer L
Home Financials for this Owner
Home Financials are based on the most recent Mortgage that was taken out on this home.
Original Mortgage
$96,000
Interest Rate
7.45%
Mortgage Type
Fannie Mae Freddie Mac
Purchase Details
Closed on
Nov 30, 2000
Sold by
Brewer Christopher and Brewer Stephanie
Bought by
Cain Edward J and Cain Jennifer L
Home Financials for this Owner
Home Financials are based on the most recent Mortgage that was taken out on this home.
Original Mortgage
$40,313
Interest Rate
11.85%
Create a Home Valuation Report for This Property
The Home Valuation Report is an in-depth analysis detailing your home's value as well as a comparison with similar homes in the area
Home Values in the Area
Average Home Value in this Area
Purchase History
| Date | Buyer | Sale Price | Title Company |
|---|---|---|---|
| P & M Belken Properties Llc | -- | None Available | |
| Deutsche Bank National Trust Company | $50,250 | None Available | |
| Cain Edward J | -- | -- | |
| Cain Edward J | -- | -- |
Source: Public Records
Mortgage History
| Date | Status | Borrower | Loan Amount |
|---|---|---|---|
| Previous Owner | Cain Edward J | $96,000 | |
| Previous Owner | Cain Edward J | $40,313 |
Source: Public Records
Tax History Compared to Growth
Tax History
| Year | Tax Paid | Tax Assessment Tax Assessment Total Assessment is a certain percentage of the fair market value that is determined by local assessors to be the total taxable value of land and additions on the property. | Land | Improvement |
|---|---|---|---|---|
| 2025 | $1,353 | $22,600 | $1,100 | $21,500 |
| 2024 | $1,353 | $21,100 | $1,100 | $20,000 |
| 2023 | $1,353 | $21,100 | $1,100 | $20,000 |
| 2022 | $1,350 | $21,100 | $1,100 | $20,000 |
| 2021 | $1,349 | $21,100 | $1,100 | $20,000 |
| 2020 | $1,251 | $19,200 | $900 | $18,300 |
| 2019 | $1,250 | $19,200 | $900 | $18,300 |
| 2018 | $1,218 | $19,200 | $900 | $18,300 |
| 2017 | $1,214 | $19,200 | $900 | $18,300 |
| 2016 | $1,095 | $17,000 | $700 | $16,300 |
| 2015 | -- | $17,000 | $700 | $16,300 |
Source: Public Records
Map
Nearby Homes
- 708 S 2nd St
- 720 S 3rd St
- 611 S 3rd St
- 221 W Miller St
- 52 Highway E (Veterans Dr ) Hwy
- 0 Hwy E-Veterans Hwy Unit MIS25014230
- 53 HIGHWAY E (Vererans Dr) Dr
- 424 S 2nd St
- 614 W Saint Louis St
- 623 Boyne St
- 701 Blow St
- 716 W Saint Louis St
- 500 E Stone St
- 267 Maple St
- 609 W Clement St
- 54 Veterans Dr
- 0 Kennett St
- 720 Kennett St
- 100 Kennett St
- 312 Oak Ln